ASP.NET Charts/Graph - Excel Application |
ASP.NET Charts/Graph - Excel Application ถ้าหากต้องการใช้งาน Excel ในการ สร้าง Charts หรือ Graph ก็สามารถทำได้เช่นเดียวกันครับ โดยเรียกใช้คุณสมบัติของ Excel ในการสร้างกราฟต่าง ๆ ซึ่งถ้าเรารู้ Syntax เราจะสามารถสร้างกราฟได้อย่างง่ายดาย และในบทเรียนนี้ผมได้ยกตัวอย่างการสร้างกราฟหลายๆ รูปแบบ (สามารถดูชนิดของกราฟได้ที่ Graph Type ID)
Framework 1.1,2.0,3.0,4,0
Excel for C# อ่านและดัดแปลงได้จากบทความนี้
ASP.NET Chart - asp:Chart
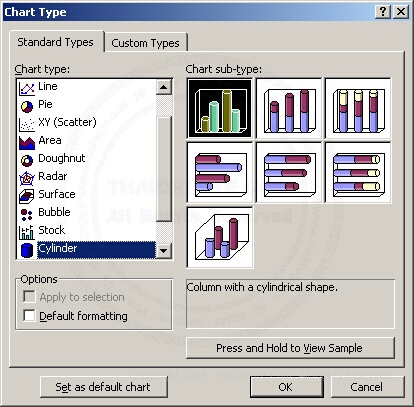
ASP Charts/Graph Type ID (Excel.Application)

ตัวอย่างกราฟบน Excel ซึ่ง ASP.NET สามารถเรียกใช้งานได้หลังจากที่ Add Reference
ASP.NET Config Excel (Excel Application)
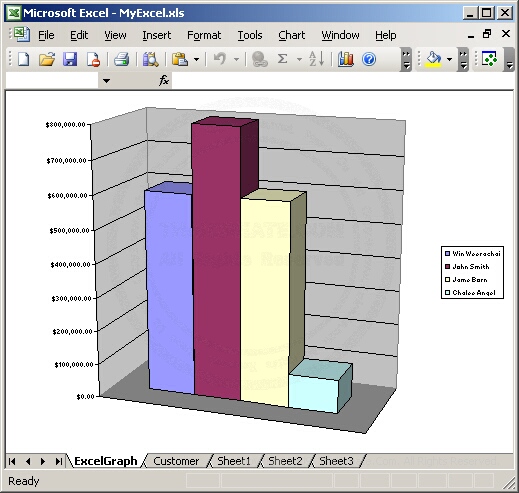
ตัวอย่างแรกจะเป็นการสร้างกราฟแท่งแบบง่าย ๆ
AspNetExcelCharts1.aspx
<%@ Import Namespace="System.Data"%>
<%@ Import Namespace="System.Data.OleDb"%>
<%@ Import Namespace="Excel"%>
<%@ Import Namespace="System.IO"%>
<%@ Page Language="VB" %>
<script runat="server">
    Sub Page_Load(sender As Object, e As EventArgs)
		Dim objConn As New OleDbConnection
        Dim dtAdapter As OleDbDataAdapter
        Dim dt As New System.Data.DataTable

        Dim strConnString As String
        strConnString = "Provider=Microsoft.Jet.OLEDB.4.0;Data Source=" & Server.MapPath("database/mydatabase.mdb") & ";"
        objConn = New OleDbConnection(strConnString)
        objConn.Open()

        Dim strSQL As String
        strSQL = "SELECT * FROM customer"

        '*** Create DataTable ***'
        dtAdapter = New OleDbDataAdapter(strSQL, objConn)
        dtAdapter.Fill(dt)

        '*** Export To Excel ***'
        Dim FileName As String = "MyXls/MyExcel.xls"

        '*** Create Exce.Application ***'
        Dim xlApp As New Excel.Application
        Dim xlSheet As Excel.Worksheet
        Dim xlBook As Excel.Workbook
        Dim i, intStartRows, intEndRows As Integer


        xlBook = xlApp.Workbooks.Add()
        xlSheet = xlBook.Worksheets(1)

        xlBook.Application.Visible = False

        xlBook.Sheets.Add()
        xlBook.ActiveSheet.Name = "Customer"

        With xlBook.Sheets("Customer").Cells(1, 1)
            .Value = "My Customer"
            .Font.Bold = True
            .Font.Name = "Tahoma"
            .Font.Size = 16
        End With

        With xlBook.Sheets("Customer").Cells(2, 1)
            .Value = "Customer Name"
            .Font.Name = "Tahoma"
            .BORDERS.Weight = 1
            .Font.Size = 10
            .MergeCells = True
        End With

        With xlBook.Sheets("Customer").Cells(2, 2)
            .Value = "Used"
            .BORDERS.Weight = 1
            .Font.Name = "Tahoma"
            .Font.Size = 10
            .MergeCells = True
        End With

        intStartRows = 3
        intEndRows = intStartRows + dt.Rows.Count - 1
        For i = 0 To dt.Rows.Count - 1
            xlBook.Sheets("Customer").Cells(intStartRows + i, 1).Value = dt.Rows(i)("Name")
            xlBook.Sheets("Customer").Cells(intStartRows + i, 2).Value = dt.Rows(i)("Used")
            xlBook.Sheets("Customer").Cells(intStartRows + i, 2).NumberFormat = "$#,##0.00"
        Next

        '*** Creating Chart ***'
        xlBook.Charts.Add()
        xlBook.ActiveChart.Name = "ExcelGraph"
        xlBook.Charts("ExcelGraph").SetSourceData(xlBook.Sheets("Customer").Range("A" & intStartRows & ":B" & intEndRows & ""))

        '*** Chart 3D Columns ***'
        With xlBook.Charts("ExcelGraph")
            .ChartType = 54
            .PlotBy = 1
            .HasAxis(1) = 0
        End With

        '*** If Files Already Exist Delete files ***'
		Dim MyFile As New FileInfo(Server.MapPath(FileName))
		If MyFile.Exists Then
			MyFile.Delete()
		End IF
		MyFile = Nothing

        '*** Save Excel ***'
        'xlSheet.PrintOut 1 '*** Print to printer ***'
        xlSheet.SaveAs(Server.MapPath(FileName))
        xlApp.Quit()

        '*** Quit and Clear Object ***'
        xlSheet = Nothing
        xlBook = Nothing
        xlApp = Nothing

        '*** End Export To Excel ***'

        Me.lblText.Text = "Charts Created <a href=" & FileName & ">Click here</a> to Download."

        dtAdapter = Nothing
        objConn.Close()
        objConn = Nothing

	End Sub
</script>
<html>
<head>
<title>ThaiCreate.Com ASP.NET - Excel Application</title>
</head>
<body>
	<form id="form1" runat="server">
	<asp:Label id="lblText" runat="server"></asp:Label>
	</form>
</body>
</html>
Screenshot

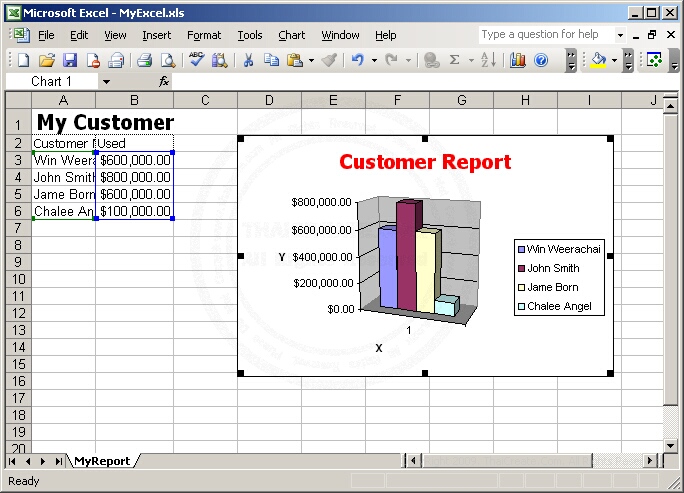
ตัวอย่างที่ 2 สร้างข้อมูลและกราฟอยู่ใน Sheet เดียวกัน
AspNetExcelCharts2.aspx
<%@ Import Namespace="System.Data"%>
<%@ Import Namespace="System.Data.OleDb"%>
<%@ Import Namespace="Excel"%>
<%@ Import Namespace="System.IO"%>
<%@ Page Language="VB" %>
<script runat="server">
    Sub Page_Load(sender As Object, e As EventArgs)
		Dim objConn As New OleDbConnection
        Dim dtAdapter As OleDbDataAdapter
        Dim dt As New System.Data.DataTable

        Dim strConnString As String
        strConnString = "Provider=Microsoft.Jet.OLEDB.4.0;Data Source=" & Server.MapPath("database/mydatabase.mdb") & ";"
        objConn = New OleDbConnection(strConnString)
        objConn.Open()

        Dim strSQL As String
        strSQL = "SELECT * FROM customer"

        '*** Create DataTable ***'
        dtAdapter = New OleDbDataAdapter(strSQL, objConn)
        dtAdapter.Fill(dt)

        '*** Export To Excel ***'
        Dim FileName As String = "MyXls/MyExcel.xls"

        '*** Create Exce.Application ***'
        Dim xlApp As New Excel.Application
        Dim xlSheet As Excel.Worksheet
        Dim xlBook As Excel.Workbook
        Dim i, intStartRows, intEndRows As Integer

        xlBook = xlApp.Workbooks.Add()
        xlSheet = xlBook.Worksheets(1)

        xlApp.Application.Visible = False

        '*** Delete Sheet (2,3) - Sheet Default ***'
        xlBook.Worksheets(2).Select()
        xlBook.Worksheets(2).Delete()
        xlBook.Worksheets(2).Select()
        xlBook.Worksheets(2).Delete()

        '*** Sheet Data Rows ***'
        xlBook.Worksheets(1).Name = "MyReport"
        xlBook.Worksheets(1).Select()

        With xlBook.ActiveSheet.Cells(1, 1)
            .Value = "My Customer"
            .Font.Bold = True
            .Font.Name = "Tahoma"
            .Font.Size = 16
        End With

        With xlBook.ActiveSheet.Cells(2, 1)
            .Value = "Customer Name"
            .Font.Name = "Tahoma"
            .BORDERS.Weight = 1
            .Font.Size = 10
            .MergeCells = True
        End With

        With xlBook.ActiveSheet.Cells(2, 2)
            .Value = "Used"
            .BORDERS.Weight = 1
            .Font.Name = "Tahoma"
            .Font.Size = 10
            .MergeCells = True
        End With

        intStartRows = 3
        intEndRows = intStartRows + dt.Rows.Count - 1
        For i = 0 To dt.Rows.Count - 1
            xlBook.ActiveSheet.Cells(intStartRows + i, 1).Value = dt.Rows(i)("Name")
            xlBook.ActiveSheet.Cells(intStartRows + i, 2).Value = dt.Rows(i)("Used")
            xlBook.ActiveSheet.Cells(intStartRows + i, 2).NumberFormat = "$#,##0.00"
        Next

        '*** Creating Chart ***'
        xlBook.Charts.Add()
        xlBook.ActiveChart.ChartType = 54
        xlBook.ActiveChart.SetSourceData(xlBook.Sheets("MyReport").Range("A" & intStartRows & ":B" & intEndRows & ""))
        'xlBook.ActiveChart.SeriesCollection(1).Name = "Series1"
        'xlBook.ActiveChart.SeriesCollection(2).Name = "Series1"
        xlBook.ActiveChart.Location(2, "MyReport")

        '*** Sheet Properties ***'
        With xlBook.ActiveChart
            .HasTitle = True
            '.PlotBy = 1
            .HasAxis(1) = 1
            .ChartTitle.Text = "Customer Report"
            .ChartTitle.Characters.Text = "Customer Report"
            .ChartTitle.Font.Name = "Tahoma"
            .ChartTitle.Font.FontStyle = "Bold"
            .ChartTitle.Font.Size = 20
            .ChartTitle.Font.ColorIndex = 3
            .Axes(1, 1).HasTitle = True
            .Axes(1, 1).AxisTitle.Characters.Text = "X"
            .Axes(2, 1).HasTitle = True
            .Axes(2, 1).AxisTitle.Characters.Text = "Y"
            .HasDataTable = False '*** DataTable (False/True) ***'
        End With

        '*** Set Area ***'
        xlBook.ActiveSheet.Shapes("Chart 1").IncrementLeft(20)
        xlBook.ActiveSheet.Shapes("Chart 1").IncrementTop(-97.5)


        '*** Set Height & Width ***'
        xlBook.ActiveSheet.Shapes("Chart 1").ScaleHeight(1.0, 0, 0)
        xlBook.ActiveSheet.Shapes("Chart 1").ScaleWidth(1.0, 0, 0)

        '*** If Files Already Exist Delete files ***'
		Dim MyFile As New FileInfo(Server.MapPath(FileName))
		If MyFile.Exists Then
			MyFile.Delete()
		End IF
		MyFile = Nothing

        '*** Save Excel ***'
        'xlSheet.PrintOut 1 '*** Print to printer ***'
        xlSheet.SaveAs(Server.MapPath(FileName))
        xlApp.Quit()

        '*** Quit and Clear Object ***'
        xlSheet = Nothing
        xlBook = Nothing
        xlApp = Nothing

        '*** End Export To Excel ***'

        Me.lblText.Text = "Charts Created <a href=" & FileName & ">Click here</a> to Download."

        dtAdapter = Nothing
        objConn.Close()
        objConn = Nothing
	End Sub
</script>
<html>
<head>
<title>ThaiCreate.Com ASP.NET - Excel Application</title>
</head>
<body>
	<form id="form1" runat="server">
	<asp:Label id="lblText" runat="server"></asp:Label>
	</form>
</body>
</html>
Screenshot

สำหรับการ Save ในรูปแบบไฟล์ .JPG หรือ .GIF สามาถอ่านได้จากหัวข้อถัดไปครับ
|
 ช่วยกันสนับสนุนรักษาเว็บไซต์ความรู้แห่งนี้ไว้ด้วยการสนับสนุน Source Code 2.0 ของทีมงานไทยครีเอท ช่วยกันสนับสนุนรักษาเว็บไซต์ความรู้แห่งนี้ไว้ด้วยการสนับสนุน Source Code 2.0 ของทีมงานไทยครีเอท
|
|
| |
By : |
ThaiCreate.Com Team (บทความเป็นลิขสิทธิ์ของเว็บไทยครีเอทห้ามนำเผยแพร่ ณ เว็บไซต์อื่น ๆ) |
| |
Score Rating : |
    |
|
| |
Create/Update Date : |
2008-10-26 21:23:14 /
2017-03-29 11:48:43 |
| |
Download : |

|
|
|
Sponsored Links / Related |
|
|
|
|
|
|

|