 |
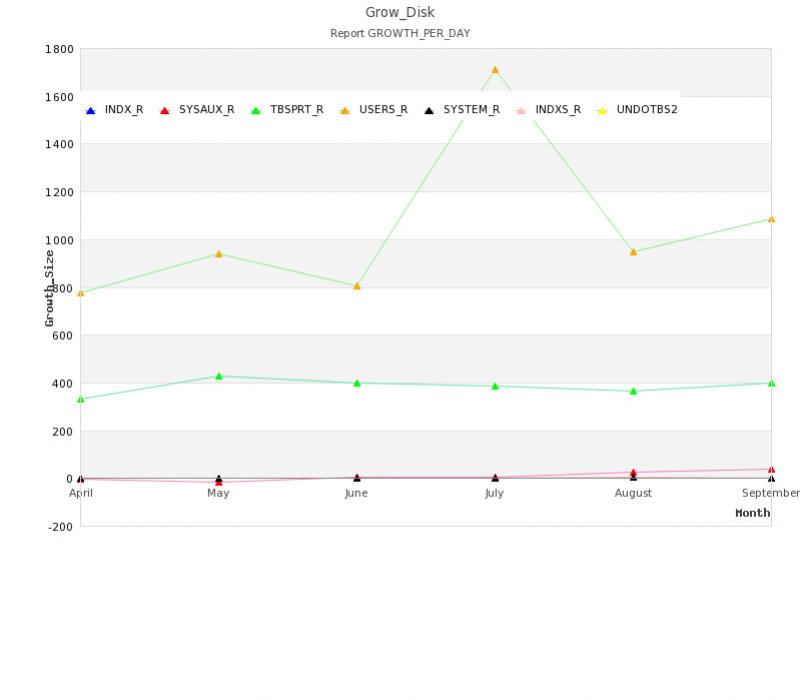
JPGraph Set แกน Y ไม่ให้ซ้อนข้อมูล และ SET Legand ไม่ให้ทับกราฟ SET ยังไงคับ (ได้แล้วคับบ) |
| |
 |
|
|
 |
 |
|
ข้อมูล มันได้มาแบบนี้อ่ะคับ set แล้ว มันก็แก้ไม่หาย รบกวนด้วยคับ

Code (PHP)
<?
$width=800;
$height=700;
// Create the graph and set a scale.
// These two calls are always required
$graph = new Graph($width,$height);
$graph->SetScale('textlin');
$graph->SetShadow();

// Setup margin and titles

$graph->SetMargin(80,30,10,50);
$graph->title->Set('Grow_Disk');
$graphsubtitle = "Report GROWTH_PER_DAY";
$graph->subtitle->Set($graphsubtitle);
$graph->xaxis->title->Set('Month');
$graph->yaxis->title->Set('Growth_Size');

$graph->yaxis->title->SetFont( FF_FONT1 , FS_BOLD );
$graph->xaxis->title->SetFont( FF_FONT1 , FS_BOLD );

$graph->yaxis->SetColor('black');

// Create the linear plot1
$lineplot1=new LinePlot($indx_r);
$lineplot1->SetColor( 'blue' );
$lineplot1->SetWeight( 2 );   // Two pixel wide
$lineplot1->mark->SetType(MARK_UTRIANGLE);
$lineplot1->mark->SetColor('blue');
$lineplot1->mark->SetFillColor('blue');

// Create the linear plot2
$lineplot2=new LinePlot($sysaux_r);
$lineplot2->SetColor( 'red' );
$lineplot2->SetWeight( 2 );   // Two pixel wide
$lineplot2->mark->SetType(MARK_UTRIANGLE);
$lineplot2->mark->SetColor('red');
$lineplot2->mark->SetFillColor('red');

 // Create the linear plot3
$lineplot3=new LinePlot($tbsprt_r);
$lineplot3->SetColor( 'green' );
$lineplot3->SetWeight( 2 );   // Two pixel wide
$lineplot3->mark->SetType(MARK_UTRIANGLE);
$lineplot3->mark->SetColor('green');
$lineplot3->mark->SetFillColor('green');

// Create the linear plot4
$lineplot4=new LinePlot($users_r);
$lineplot4->SetColor( 'orange' );
$lineplot4->SetWeight( 2 );   // Two pixel wide
$lineplot4->mark->SetType(MARK_UTRIANGLE);
$lineplot4->mark->SetColor('orange');
$lineplot4->mark->SetFillColor('orange');

// Create the linear plot5
$lineplot5=new LinePlot($system_r);
$lineplot5->SetColor( 'black' );
$lineplot5->SetWeight( 2 );   // Two pixel wide
$lineplot5->mark->SetType(MARK_UTRIANGLE);
$lineplot5->mark->SetColor('black');
$lineplot5->mark->SetFillColor('black');

// Create the linear plot6
$lineplot6=new LinePlot($indxs_r);
$lineplot6->SetColor( 'pink' );
$lineplot6->SetWeight( 2 );   // Two pixel wide
$lineplot6->mark->SetType(MARK_UTRIANGLE);
$lineplot6->mark->SetColor('pink');
$lineplot6->mark->SetFillColor('pink');

// Create the linear plot7
$lineplot7=new LinePlot($undotbs2_r);
$lineplot7->SetColor( 'yellow' );
$lineplot7->SetWeight( 2 );   // Two pixel wide
$lineplot7->mark->SetType(MARK_UTRIANGLE);
$lineplot7->mark->SetColor('yellow');
$lineplot7->mark->SetFillColor('yellow');

$graph->xaxis->SetTickLabels($smonth);

// SetLegend   //คำอธิบาย
$lineplot1->SetLegend('INDX_R');
$lineplot2->SetLegend('SYSAUX_R');
$lineplot3->SetLegend('TBSPRT_R');
$lineplot4->SetLegend('USERS_R');
$lineplot5->SetLegend('SYSTEM_R');
$lineplot6->SetLegend('INDXS_R');
$lineplot7->SetLegend('UNDOTBS2');

//$graph->legend->Pos(0.00,0.5,"top","center");
$graph->legend->SetLayout(LEGEND_HOR);
$graph->legend->Pos(0.10,0.13,'left','top');

$graph->img->SetAntiAliasing();

// Add the plot to the graph
$graph->Add($lineplot1);
$graph->Add($lineplot2);
$graph->Add($lineplot3);
$graph->Add($lineplot4);
$graph->Add($lineplot5);
$graph->Add($lineplot6);
$graph->Add($lineplot7);

// Display the graph
$graph->Stroke();

?>
Tag : PHP
|
ประวัติการแก้ไข
2011-09-30 16:00:56
2011-09-30 16:25:05
|
 |
 |
 |
 |
| Date :
2011-09-30 15:59:46 |
By :
l3ankkiZ |
View :
1401 |
Reply :
1 |
|
 |
 |
 |
 |
|
|
|
|
 |
 |
|
 |
 |
 |
|
|
 |
 |
|
$graph->img->SetMargin(ระยะห่าจากซ้าย,ขวา,บน,ล่าง);
ตัวอย่าง
$graph->img->SetMargin(50,50,20,40);
|
 |
 |
 |
 |
| Date :
2013-09-20 17:21:43 |
By :
mpirial |
|
 |
 |
 |
 |
|
|
 |
 |
|
 |
 |
|
|