 |
ใช้จาวาสคริป วนลูปดึงข้อมูลจากฐานข้อมูลมาสร้าง "กราฟ" ได้รึป่าว ครับ |
| |
 |
|
|
 |
 |
|
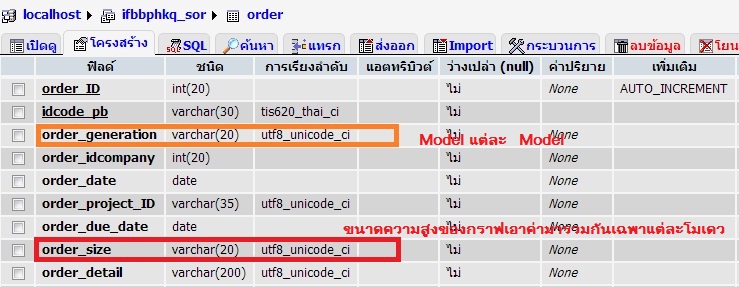
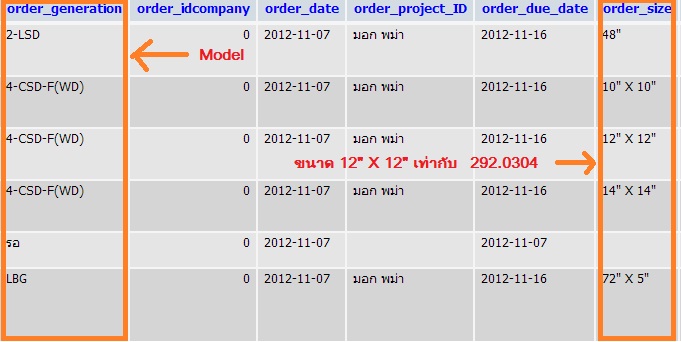
ผมต้องการดึงข้อมูล จากฐานข้อมูล รบกวนแนะนำหน่อย ครับ
Code (JavaScript)
<script type="text/javascript" src="https://www.google.com/jsapi"></script>
    <script type="text/javascript">
      google.load("visualization", "1", {packages:["corechart"]});
      google.setOnLoadCallback(drawChart);

      function drawChart() {
        var data = google.visualization.arrayToDataTable([
          ['Year', 'square'],
          ['ASD',  5100],
          ['ARD',  50000], // ผมต้องการดึงข้อมูล จาก 2 ฟิว มาแทน ค่า 2 ค่านี้ โดย ฟิว order_generation แทน Year และ order_sizeแทน square
          ['CSD',  9500],
          ['CRD',  4335],
          ['RD',   11534],
          ['HRG',  6510],
          ['WSG',  7530],
          ['LBG',  3540],
          ['LSD',  9510],
          ['RAL',  12519],
          ['OBD',  6510],
          ['PFR',  9510],
          ['FAG',  9530],
          ['SAL',  11140],


        ]);

        var options = {
          title: 'Model',
          vAxis: {title: "square metre"},
          width: data.getNumberOfRows() * 65,
          bar: {groupWidth: 35},
          tooltip: {textStyle: {color: '#3C6A9D'}, showColorCode: true},
          chartArea : {left:80,top:60,width:"80%", height: "60%"}

        };


        var chart = new google.visualization.ColumnChart(document.getElementById('chart_div'));
        chart.draw(data, options);
      }
    </script>
 <style>
กราฟ

ฐานข้อมูล ครับ

//---------------------------------------------

Tag : PHP, MySQL, HTML/CSS, Ajax, jQuery, JAVA
|
ประวัติการแก้ไข
2012-12-26 14:44:17
2012-12-26 14:46:56
2012-12-26 14:58:34
2012-12-26 15:25:31
|
 |
 |
 |
 |
| Date :
2012-12-26 14:39:49 |
By :
TonsoR |
View :
4237 |
Reply :
3 |
|
 |
 |
 |
 |
|
|
|
|
 |
 |
|
 |
 |
 |
|
|
 |
 |
|
ทำได้ครับ แนวทางตามตัวอย่างข้างล่าง
ประยุกต์เองน่ะครับ (PHP)
<?php
//  สมมุติว่า ข้อมูลนี้ select มาจาก db น่ะครับ

$hdata = array("ASD", "ARD", "CSD", "CRD", "RD", "HRG", "WSG", "LBG", "LSD", "RAL", "OBD", "PFR","FAG","SAL");
$data=array(5100,50000,9500,4335,11534,6510,7530,3540,9510,12519,6510,9510,9530,11140)
?>
<script type="text/javascript" src="https://www.google.com/jsapi"></script>
    <script type="text/javascript">
      google.load("visualization", "1", {packages:["corechart"]});
      google.setOnLoadCallback(drawChart);

      function drawChart() {
        var data = google.visualization.arrayToDataTable([
          ['Year', 'square'],
          <?php
            for($i=0;$i<count($hdata);$i++){
              echo "['".$hdata[$i]."',".$data[$i]."],";
            }
          ?>
        ]);

        var options = {
          title: 'Model',
          vAxis: {title: "square metre"},
          width: data.getNumberOfRows() * 65,
          bar: {groupWidth: 35},
          tooltip: {textStyle: {color: '#3C6A9D'}, showColorCode: true},
          chartArea : {left:80,top:60,width:"80%", height: "60%"}

        };


        var chart = new google.visualization.ColumnChart(document.getElementById('chart_div'));
        chart.draw(data, options);
      }
    </script>
 <div class="chart_div " id="chart_div"></div>
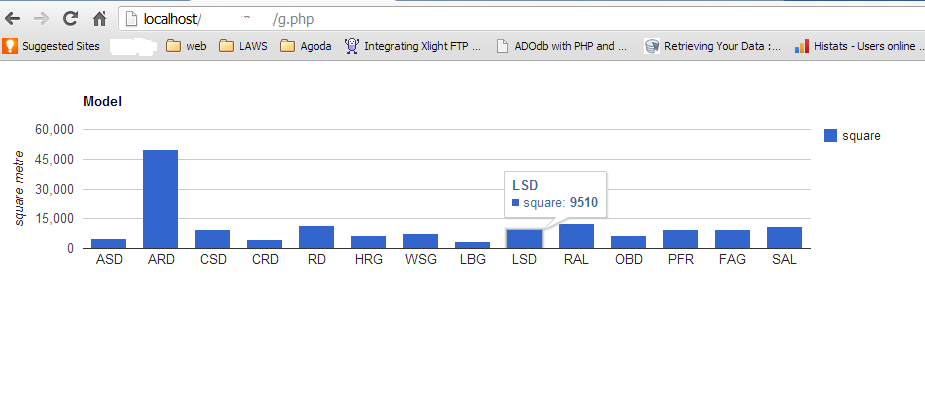
ตัวอย่างผลลัพธ์จากโค้ทนี้

|
 |
 |
 |
 |
| Date :
2012-12-26 19:52:33 |
By :
mangkunzo |
|
 |
 |
 |
 |
|
|
 |
 |
|
 |
 |
 |
|
|
 |
 |
|
ขอบคุณมากๆ ครับ ผมจะนำไปปรับ ใช้ 
|
 |
 |
 |
 |
| Date :
2012-12-28 10:37:23 |
By :
TonsoR |
|
 |
 |
 |
 |
|
|
 |
 |
|
 |
 |
|
|