 |
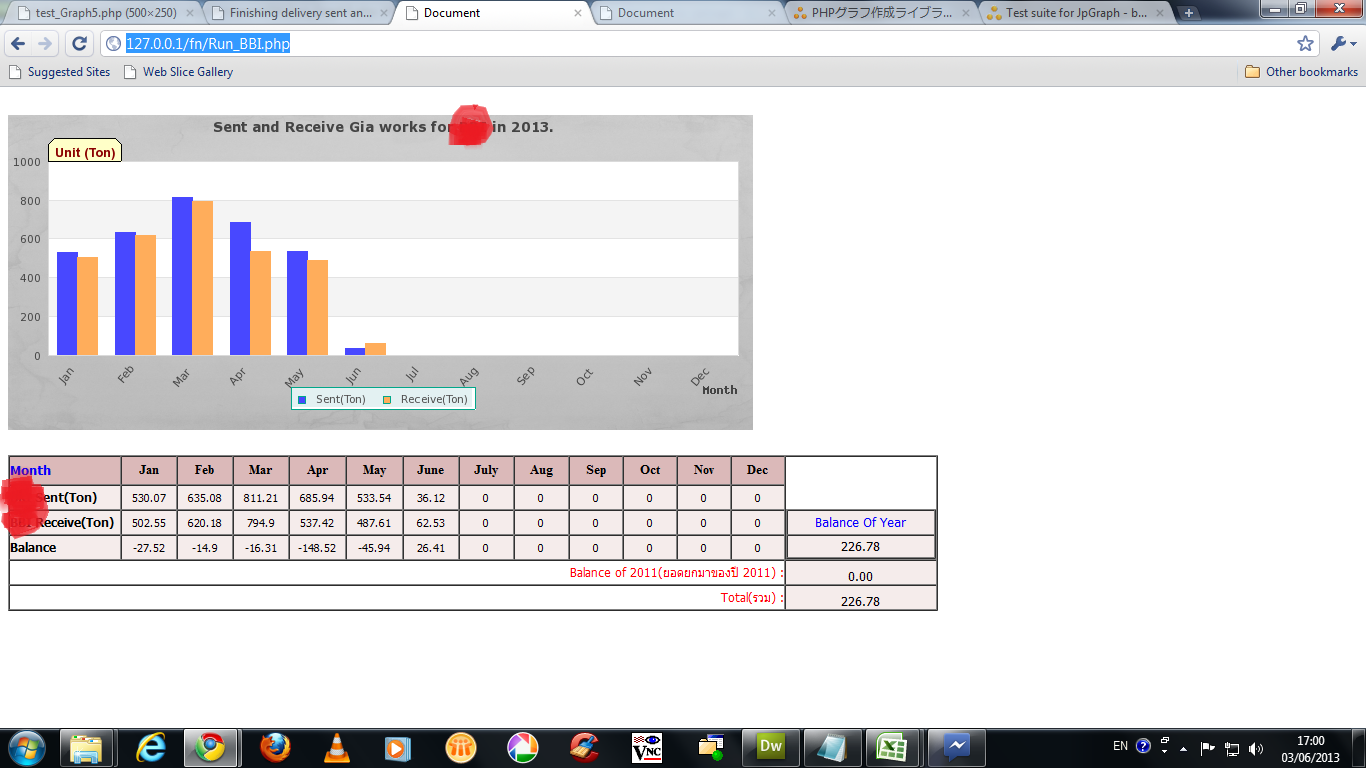
ค่าบนกราฟแท่งไม่ออกครับช่วยดูให้หน่อยครับ เอา Code ที่มี ข้อมูลบนแท่งกราฟมาใส่ดูก็ไม่ออก ช่วยทีนะครับ |
| |
 |
|
|
 |
 |
|
ค่าบนกราฟแท่งไม่ออกครับช่วยดูให้หน่อยครับ

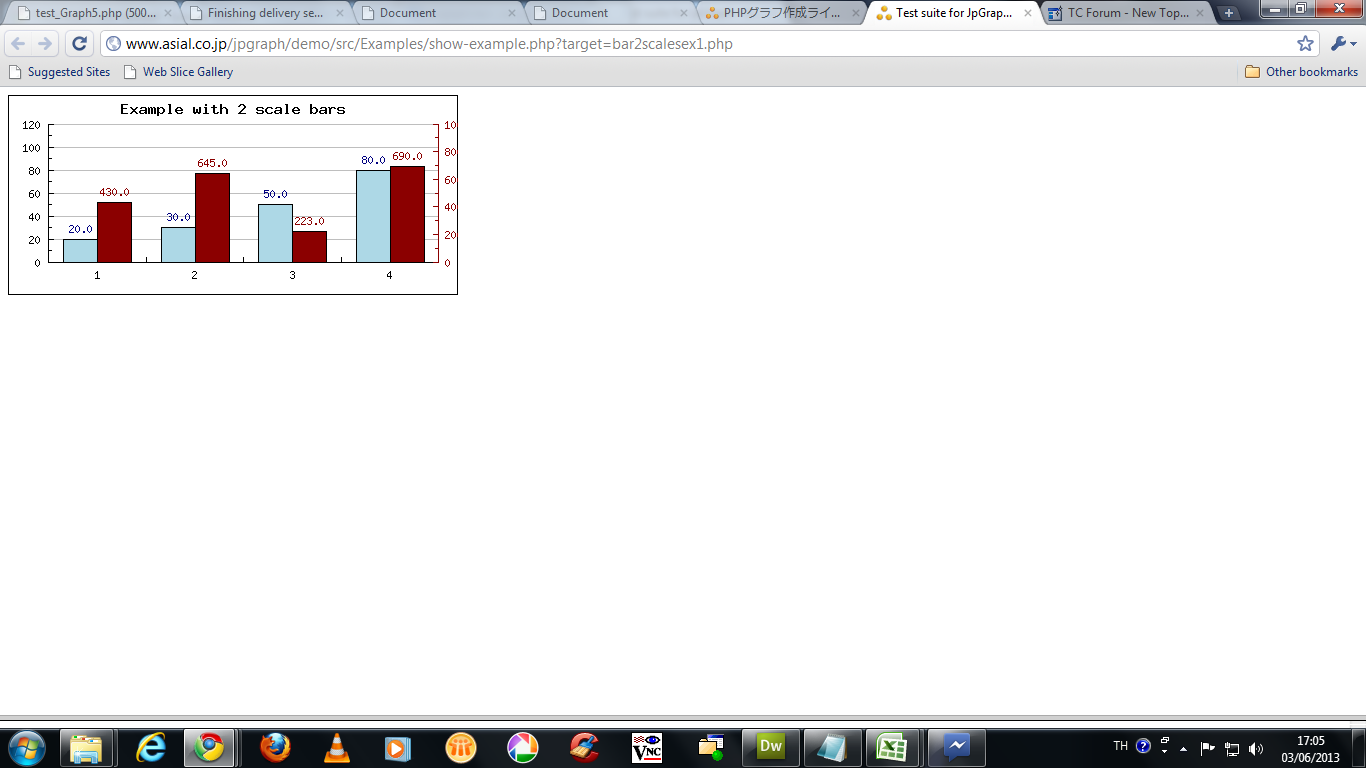
อันนี้คือที่อยากให้ได้ครับ คือมีค่าข้อมูลบนแท่งกราฟ

ส่วนนี่ Code ครับ
Code (PHP)
<?php // content="text/plain; charset=utf-8"
//
// Example of frequence bar
//
include_once ("jpgraph/src/jpgraph.php");
include_once ("jpgraph/src/jpgraph_bar.php");


$datay=array(12,26,9,17,31);

// Create the graph.
// One minute timeout for the cached image
// INLINE_NO means don't stream it back to the browser.
$graph = new Graph(310,250,'auto');
$graph->SetScale("textlin");
$graph->img->SetMargin(60,30,20,40);
$graph->yaxis->SetTitleMargin(45);
$graph->yaxis->scale->SetGrace(30);
$graph->SetShadow();

// Turn the tickmarks
$graph->xaxis->SetTickSide(SIDE_DOWN);
$graph->yaxis->SetTickSide(SIDE_LEFT);

// Create a bar pot
$bplot = new BarPlot($datay);

// Create targets for the image maps. One for each column
$targ=array("bar_clsmex1.php#1","bar_clsmex1.php#2","bar_clsmex1.php#3","bar_clsmex1.php#4","bar_clsmex1.php#5","bar_clsmex1.php#6");
$alts=array("val=%d","val=%d","val=%d","val=%d","val=%d","val=%d");
$bplot->SetCSIMTargets($targ,$alts);
$bplot->SetFillColor("orange");

// Use a shadow on the bar graphs (just use the default settings)
$bplot->SetShadow();
$bplot->value->SetFormat(" $ %2.1f",70);
$bplot->value->SetFont(FF_ARIAL,FS_NORMAL,9);
$bplot->value->SetColor("blue");
$bplot->value->Show();

$graph->Add($bplot);

$graph->title->Set("Image maps barex1");
$graph->xaxis->title->Set("X-title");
$graph->yaxis->title->Set("Y-title");

$graph->title->SetFont(FF_FONT1,FS_BOLD);
$graph->yaxis->title->SetFont(FF_FONT1,FS_BOLD);
$graph->xaxis->title->SetFont(FF_FONT1,FS_BOLD);

// Send back the HTML page which will call this script again
// to retrieve the image.
$graph->StrokeCSIM();


?>
Tag : PHP, MySQL, Windows
|
|
|
 |
 |
 |
 |
| Date :
2013-06-03 17:07:31 |
By :
TotEcom |
View :
1320 |
Reply :
4 |
|
 |
 |
 |
 |
|
|
|
|
 |
 |
|
 |
 |
 |
|
|
 |
 |
|
Code ข้างบนผิดครับ อันนี้ครับ
Code (PHP)
<?php // content="text/plain; charset=utf-8"
include_once ("jpgraph/src/jpgraph.php");
include_once ("jpgraph/src/jpgraph_bar.php");
include_once ('jpgraph/src/jpgraph_line.php');

$objConnect = mysql_connect("localhost","root","123456") or die("Error Connect to Database");
$objDB = mysql_select_db("invoice_fn");

$strSQL = "SELECT Rec_DateReceive, Remain, Rec_Sup, SUM( Rec_TotalWeight ) AS TotalWigwht
FROM recevie_grinding
WHERE Remain =0
AND Rec_Sup ='BBI'
AND Rec_DateReceive
BETWEEN '2013-05-01'
AND '2013-05-31'
GROUP BY Rec_Sup";

$objQuery = mysql_query($strSQL) or die ("Error Query [".$strSQL."]");
$datay=array();
while($rs = mysql_fetch_array($objQuery))
{
$TotalWigwht = $rs["TotalWigwht"];
$ReceiveMay=($TotalWigwht/1000);

}

$strSQL = "SELECT Rec_DateReceive, Remain, Rec_Sup, SUM( Rec_TotalWeight ) AS TotalWigwht
FROM recevie_grinding
WHERE Remain =0
AND Rec_Sup ='BBI'
AND Rec_DateReceive
BETWEEN '2013-06-01'
AND '2013-06-31'
GROUP BY Rec_Sup";

$objQuery = mysql_query($strSQL) or die ("Error Query [".$strSQL."]");
$datay=array();
while($rs = mysql_fetch_array($objQuery))
{
$TotalWigwht = $rs["TotalWigwht"];
$ReceiveJun=($TotalWigwht/1000);

}


$strSQL = "SELECT SUM( Deliv_TotalWeight ) AS TotalWeight, Deliv_Suplier
FROM delivery
WHERE Deliv_Suplier =  'BBI'
AND (
Deliv_Date
BETWEEN  '2013-05-01'
AND  '2013-05-31'
)
GROUP BY Deliv_Suplier";

$objQuery = mysql_query($strSQL) or die ("Error Query [".$strSQL."]");
$datay=array();
while($rs = mysql_fetch_array($objQuery))
{

$TotalWeight = $rs["TotalWeight"];
$SentMay=($TotalWeight/1000);
}
$strSQL = "SELECT SUM( Deliv_TotalWeight ) AS TotalWeight, Deliv_Suplier
FROM delivery
WHERE Deliv_Suplier =  'BBI'
AND (
Deliv_Date
BETWEEN  '2013-06-01'
AND  '2013-06-31'
)
GROUP BY Deliv_Suplier";

$objQuery = mysql_query($strSQL) or die ("Error Query [".$strSQL."]");
$datay=array();
while($rs = mysql_fetch_array($objQuery))
{

$TotalWeight = $rs["TotalWeight"];
$SentJun=($TotalWeight/1000);
}


//bar1
$data1y=array(530.07,635.08,811.21,685.94,$SentMay,$SentJun,0,0,0,0,0,0);
//bar2
$data2y=array(502.55,620.18,794.90,537.42,$ReceiveMay,$ReceiveJun,0,0,0,0,0,0);
//bar3
//$data3y=array(220,230,210,175,185,195,200,230,200,195,180,130,120,100);
//$data4y=array(40,45,70,80,50,75,70,70,80,75,80,50,60,70);
//$data5y=array(20,20,25,22,30,25,35,30,27,25,25,45,30,25);
//line1
//$data6y=array(50,58,60,58,53,58,57,60,58,58,57,50,50,60);
//foreach ($data6y as &$y) { $y -=10; }

// Create the graph. These two calls are always required
$graph = new Graph(750,320,'auto');
$graph->SetScale("textlin");
$graph->SetY2Scale("lin",0,90);
$graph->SetY2OrderBack(false);

$graph->SetMargin(35,50,20,5);

$theme_class = new UniversalTheme;
$graph->SetTheme($theme_class);

$graph->yaxis->SetTickPositions(array(0,10,20,30,40,50,60,70), array(25,75,125,175,275,325));
$graph->y2axis->SetTickPositions(array(30,40,50,60,70,80,90));

//$monthss = "8","9","10","11","12","13","14","15","16","17","18","19","20","21";
//$months = $gDateLocale->GetShortMonth();
//$months = array_merge(array_slice($months,3,9), array_slice($months,0,3));
$months=array("Jan","Feb","Mar","Apr","May","Jun","Jul","Aug","Sep","Oct","Nov","Dec");
$graph->SetBox(false);

$graph->ygrid->SetFill(false);
$graph->xaxis->SetTickLabels(array('A','B','C','D'));
$graph->yaxis->HideLine(false);
$graph->yaxis->HideTicks(false,false);
$graph->SetScale("textlin");
$graph->SetMarginColor("lightblue:1.1");
$graph->SetShadow();
// Setup month as labels on the X-axis
$graph->xaxis->SetTickLabels($months);
$graph->xaxis->SetLabelAngle(50);

// Create the bar plots
$b1plot = new BarPlot($data1y);
$b2plot = new BarPlot($data2y);

//$b3plot = new BarPlot($data3y);
//$b4plot = new BarPlot($data4y);
//$b5plot = new BarPlot($data5y);

//$lplot = new LinePlot($data6y);

// Create the grouped bar plot
//$gbbplot = new AccBarPlot(array($b3plot,$b4plot,$b5plot));
$gbplot = new GroupBarPlot(array($b1plot,$b2plot));

// ...and add it to the graPH
$graph->Add($gbplot);
//$graph->AddY2($lplot);
$graph->yaxis->SetTitleMargin(40);
$graph->yaxis->scale->SetGrace(5);
$graph->SetShadow();
$graph->xaxis->SetTickSide(SIDE_DOWN);
$graph->yaxis->SetTickSide(SIDE_LEFT);
$graph->SetBackgroundImage("C:\AppServ\www\FN\jpgraph\src\Examples\Testpicture.jpg",BGIMG_FILLFRAME);


$b2plot->SetColor("#FFAD5B");
$b2plot->SetFillColor("#FFAD5B");
//$b1plot->SetBorder(1);
$b2plot->SetLegend("Receive(Ton)");

$b1plot->SetColor("#4848FF");
$b1plot->SetFillColor("#4848FF");
//$b1plot->SetBorder(1);
$b1plot->SetLegend("Sent(Ton)");


//$b3plot->SetColor("#8B008B");
//$b3plot->SetFillColor("#8B008B");
//$b3plot->SetLegend("First Track");

//$b4plot->SetColor("#DA70D6");
//$b4plot->SetFillColor("#DA70D6");
//$b4plot->SetLegend("All");


//$b5plot->SetColor("#9370DB");
//$b5plot->SetFillColor("#9370DB");
//$b5plot->SetLegend("Single Only");


//$lplot->SetBarCenter();
//$lplot->SetColor("yellow");
//$lplot->SetLegend("Houses");
//$lplot->mark->SetType(MARK_X,'',1.0);
//$lplot->mark->SetWeight(2);
//$lplot->mark->SetWidth(8);
//$lplot->mark->setColor("red");
//$lplot->mark->setFillColor("red");

$graph->legend->SetFrameWeight(1);
$graph->legend->SetColumns(6);
$graph->legend->SetColor('#4E4E4E','#00A78A');
$band = new PlotBand(VERTICAL,BAND_RDIAG,11,"max",'khaki4');
$band->ShowFrame(true);
$band->SetOrder(DEPTH_BACK);
$graph->Add($band);
/*

$txt=new Text('ทดสอบ');
$txt->SetPos(10,20);
$txt->SetColor('darkred');
$txt->SetFont(FF_ANGSA,FS_BOLD,15);
$txt->SetBox('yellow','navy','[email protected]');
$graph->AddText($txt);
*/
$graph->tabtitle->Set('Unit (Ton)');
$graph->tabtitle->SetFont(FF_ARIAL,FS_BOLD,10);
$graph->xaxis->title->Set('Month');
$graph->xaxis->title->SetFont(FF_FONT1,FS_BOLD);
$graph->yaxis->title->Set('Unit(Ton)');
$graph->yaxis->title->SetFont(FF_FONT1,FS_BOLD);
$graph->legend->SetBackgroundGradient("#E3F1F2", "#E3F1F2", GRAD_HOR, BGRAD_MARGIN);
$graph->title->SetFont(FF_VERDANA,FS_BOLD,10);
$graph->title->Set("Sent and Receive Gia works for BBI in 2013.");


// Display the graph
$graph->Stroke();
?>
|
 |
 |
 |
 |
| Date :
2013-06-03 17:12:41 |
By :
TotEcom |
|
 |
 |
 |
 |
|
|
 |
 |
|
 |
 |
 |
|
|
 |
 |
|
$bplot->value->Show();
|
 |
 |
 |
 |
| Date :
2013-06-03 17:50:33 |
By :
WiTT |
|
 |
 |
 |
 |
|
|
 |
 |
|
 |
 |
 |
|
|
 |
 |
|
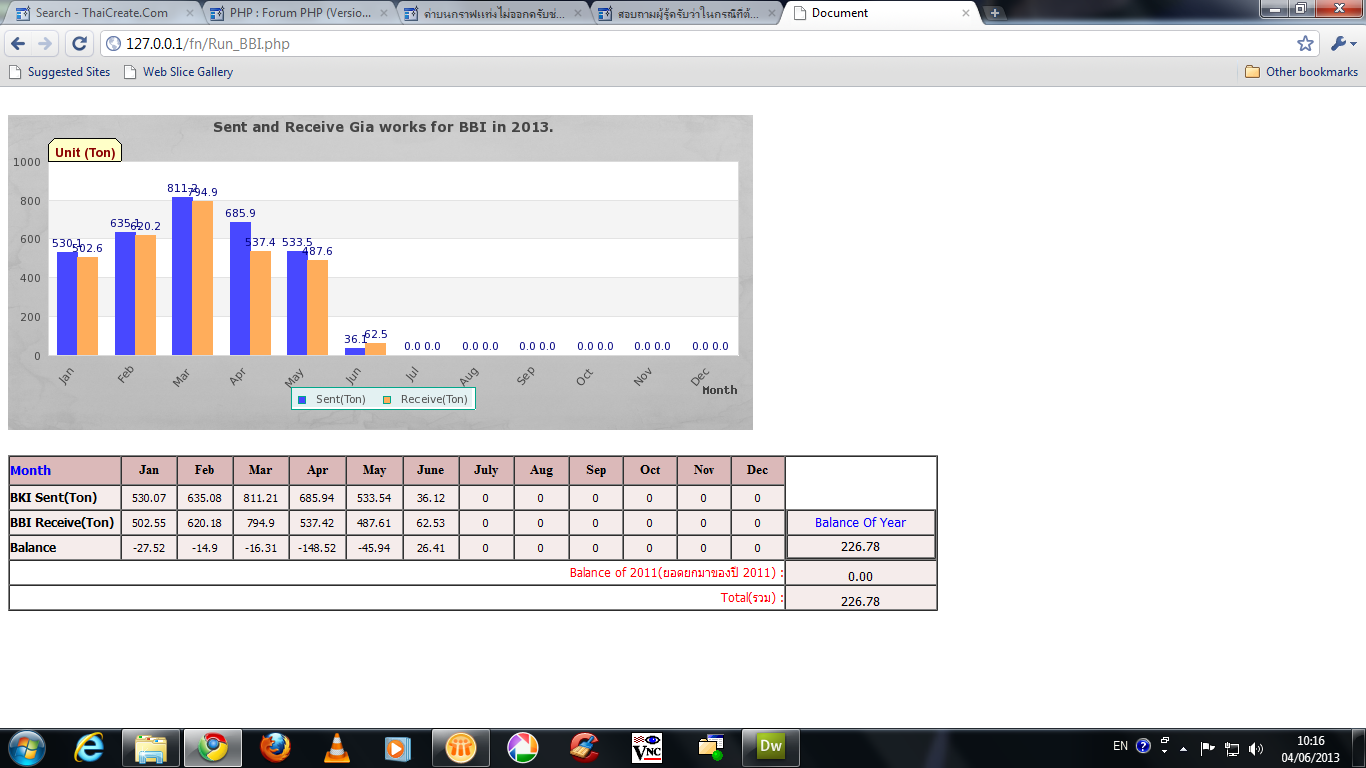
Show ออกมาแล้วครับแต่ข้อมูลยังทับกันอยู่ทำให้ดูยากขึ้น

|
 |
 |
 |
 |
| Date :
2013-06-04 10:16:40 |
By :
TotEcom |
|
 |
 |
 |
 |
|
|
 |
 |
|
 |
 |
 |
|
|
 |
 |
|
ได้แล้วครับขอบคุณที่ช่วยเหลือครับ
|
 |
 |
 |
 |
| Date :
2013-06-04 13:11:27 |
By :
TotEcom |
|
 |
 |
 |
 |
|
|
 |
 |
|
 |
 |
|
|