|
 |
| |
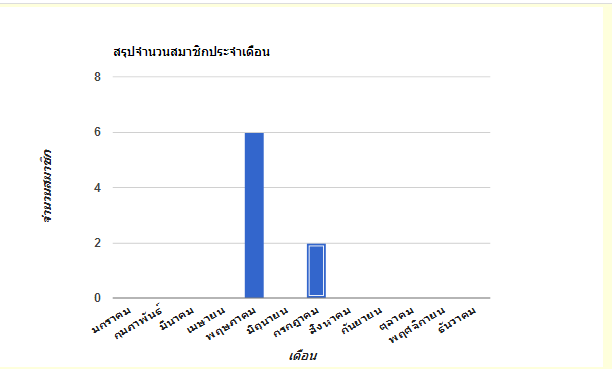
สอบถามเรื่องการแสดงค่าบนแท่งกราฟ google chart ครับ |
| |
 |
|
|
 |
 |
|
สอบถามผู้รู้ครับ อยากแสดงค่าข้างบนแท่งกราฟอ่ะครับ มีใครพอรู้บ้างไหมอ่ะครับ

Code (JavaScript)
<script type="text/javascript" src="https://www.google.com/jsapi"></script>
    <script type="text/javascript">
      google.load("visualization", "1", {packages:["corechart"]});
      google.setOnLoadCallback(drawChart);
      function drawChart() {
        var data = google.visualization.arrayToDataTable([<?=$chart?>]);
        var options =
		{
          title: 'สรุปจำนวนสมาชิกประจำเดือน',
     vAxis: {title: "จำนวนสมาชิก"},
            hAxis: {title: "เดือน"},
   isStacked: true,
    'legend': 'none',
        }
        var chart = new google.visualization.ColumnChart(document.getElementById('chart_show'));
        chart.draw(data, options);
      }
</script>
Tag : PHP, MySQL, JavaScript

|
|
|
 |
 |
 |
 |
| Date :
2014-07-13 02:12:01 |
By :
jpong7 |
View :
1611 |
Reply :
1 |
|
 |
 |
 |
 |
|
|
|
|
 |
 |
|
 |
 |
 |
|
|
 |
 |
|
Core Chart ครับ
https://google-developers.appspot.com/chart/interactive/docs/gallery/columnchart
|
 |
 |
 |
 |
| Date :
2014-07-13 02:16:11 |
By :
jpong7 |
|
 |
 |
 |
 |
|
|
 |
 |
|
 |
 |
|
|
| |

|
 Load balance : Server 00 Load balance : Server 00
|

