 |
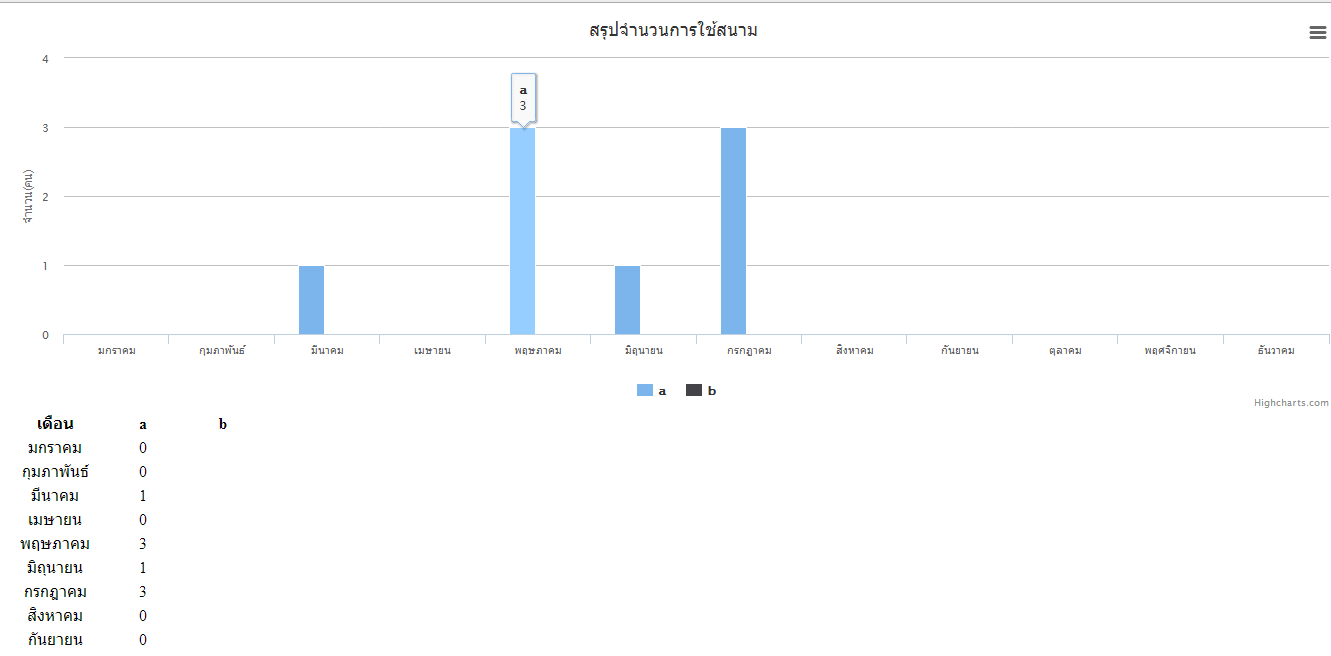
ตัวอย่างเป็นกราฟแท่งแสดงแถวเดียว อยากแสดงเป็น 2 แถวครับ |
| |
 |
|
|
 |
 |
|
คือผมอยากจะ select มาโชว์ที่ column b เพื่อแสดงเป็น 2 แถวอ่ะครับ

Code (PHP)
<?php
require_once ("../include/connection.php");
$month=array(1=>'มกราคม',2=>'กุมภาพันธ์',3=>'มีนาคม',4=>'เมษายน',5=>'พฤษภาคม',6=>'มิถุนายน',7=>'กรกฎาคม',8=>'สิงหาคม',9=>'กันยายน',10=>'ตุลาคม',11=>'พฤศจิกายน',12=>'ธันวาคม');

$s1=" SELECT DATE_FORMAT(date2member,'%c') AS month,count(userID) AS a
FROM user  WHERE YEAR(date2member) = '2014'
GROUP BY YEAR(date2member), MONTH(date2member) ORDER BY DATE_FORMAT(date2member,'%m') ASC  ";

$rs_report=mysql_query($s1) or die(mysql_error());
$chart="['ประจำเดือน','a']";

while($show_report=mysql_fetch_assoc($rs_report))
{
     $report_arr[$show_report['month']] = $show_report['a'];
}
foreach($month as $key_m => $val_m)
{
 $chart.=",['".$val_m."',".($report_arr[$key_m]*1)."]";
}
?>


<!DOCTYPE html PUBLIC "-//W3C//DTD XHTML 1.0 Transitional//EN" "http://www.w3.org/TR/xhtml1/DTD/xhtml1-transitional.dtd">
<html xmlns="http://www.w3.org/1999/xhtml">
<head>
<meta http-equiv="Content-Type" content="text/html; charset=utf-8" />
<title>Untitled Document</title>
 <title>Highcharts Example</title>
<script type="text/javascript" src="http://ajax.googleapis.com/ajax/libs/jquery/1.7.1/jquery.min.js"></script>
 <script src="http://code.highcharts.com/highcharts.js"></script>
<script src="http://code.highcharts.com/modules/data.js"></script>
<script src="http://code.highcharts.com/modules/exporting.js"></script>
<script type="text/javascript">
	$(function () {
    $('#container').highcharts({
        data: {
            table: document.getElementById('datatable')
        },
        chart: {
            type: 'column'
        },
        title: {
            text: 'สรุปจำนวนการใช้สนาม'
        },
        yAxis: {
            allowDecimals: false,
            title: {
                text: 'จำนวน(คน)'
            }
        },
        tooltip: {
            formatter: function() {
                return '<b>'+ this.series.name +'</b><br/>'+
                   // this.point.y +' '+ this.point.name.toLowerCase();
				   this.point.y;
            }
        }
    });
});

</script>

</head>
<body>

<div id="container" style="min-width: 310px; height: 400px; margin: 0 auto"></div>

<table id="datatable">
<thead>
		<tr>
			<th width="92">เดือน</th>
			<th width="76">a</th>
            <th width="76">b</th>

		</tr>
	</thead>
  <?php
  $totalRevenue=0;
  foreach($month as $key_m => $val_m)
  {
  ?>
  <tr  class="data">
    <td  class="data" align="center" bgcolor=""><?=$val_m?></td>
    <td   class="data"align="center" bgcolor=""><?=number_format(($report_arr[$key_m]))?></td>

  <? } ?>
  </tr>
</body>
</html>
Tag : PHP, MySQL, JavaScript
|
ประวัติการแก้ไข
2014-07-22 11:17:31
2014-07-22 11:17:54
2014-07-22 11:18:58
|
 |
 |
 |
 |
| Date :
2014-07-22 11:16:24 |
By :
jpong7 |
View :
2517 |
Reply :
1 |
|
 |
 |
 |
 |
|
|
|
|
 |
 |
|
 |
 |
 |
|
|
 |
 |
|
ของผมเป็นแบบนี้ลองเอาไปปรับใช้ดูคับ เพิ่มหลัง tooltip
Code (PHP)
plotOptions: {
            column: {
                pointPadding: 0.2,
                borderWidth: 0
            }
        },
        series: [{
            name: 'Tokyo',
            data: [<?= implode(',', $monthx); //นำตัวแปร array แกน x มาใส่ ในที่นี้คือ เดือน?>]

        }, {
            name: 'New York',
            data: [<?= implode(',', $monthx2) // ข้อมูล array แกน y ?>]

        }
|
 |
 |
 |
 |
| Date :
2014-07-29 13:56:57 |
By :
raulmaster |
|
 |
 |
 |
 |
|
|
 |
 |
|
 |
 |
|
|