 |
เขียนโค้ด PHP ดึงข้อมูลจากฐานข้อมูล อยากให้กราฟขึ้น 2 แท่ง ครับ |
| |
 |
|
|
 |
 |
|
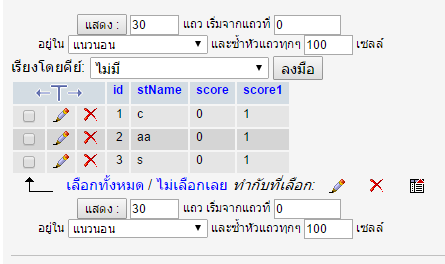
คือผมต้องการดึงข้อมูลจากฐานข้อมูลนี้
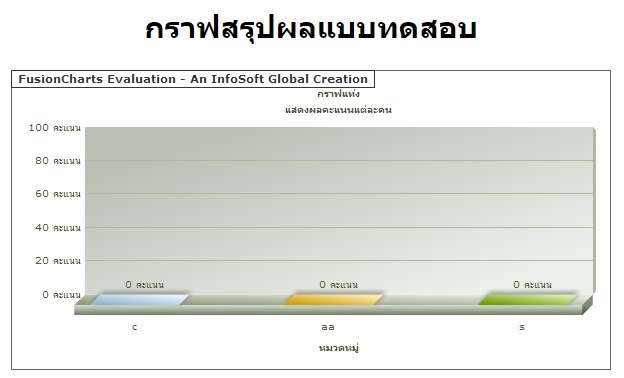
มาแสดงเปนกราฟ เปลียบเทียบ ขึ้นคู่กัน2แท่งอะครับ แต่นี้ขึ้นแท่งเดียว
นี้ครับโค้ดตรงเปลี่ยนเพิ่มตรงไหนครับ
Code (PHP)
<?php
include("../Includes/FusionCharts.php");
include("../Includes/DBConn.php");
?>
<HTML>
<HEAD>
<META http-equiv=Content-Type content="text/html; charset=utf-8">
	<TITLE>
	กราฟสรุปผลแบบทดสอบ
	</TITLE>
	<SCRIPT LANGUAGE="Javascript" SRC="../../FusionCharts/FusionCharts.js"></SCRIPT>
	<style type="text/css">
	<!--
	body {
		font-family: Arial, Helvetica, sans-serif;
		font-size: 20px;
	}
	.text{
		font-family: Arial, Helvetica, sans-serif;
		font-size: 20px;
	}
	-->
	</style>
</HEAD>
<BODY>

<CENTER>
<h2>กราฟสรุปผลแบบทดสอบ</h2>

<?php

    $link = connectToDB();
    $animateChart = $_GET['animate'];
    //Set default value of 1
    if ($animateChart=="")
        $animateChart = "1";
    $strXML = "<graph caption='กราฟแท่ง' subCaption='แสดงผลคะแนนแต่ละคน' xAxisName='หมวดหมู่' pieSliceDepth='30' showBorder='1' formatNumberScale='0' numberSuffix=' คะแนน' animation=' " . $animateChart . "'>";

 $sql = "select * score  ";
            $strQuery = "select stName,score ,score1 from score ";

            $result2 = mysql_query($strQuery) or die(mysql_error());
			$result3 = mysql_query($strQuery) or die(mysql_error());

  if ($result2) {
        while($ors2 = mysql_fetch_array($result2)) {

           $strXML .=
		   "<set name='" . $ors2['stName'] .
		    "' value='" . $ors2['score'] .

			"' />"
			;
        }
    }
	if ($result3) {
        while($ors3 = mysql_fetch_array($result3)) {

           $strXML .=
		   "' value='" . $ors3['score1'] . ""
			;
        }
    }

    mysql_close($link);

    $strXML .= "</graph>";

    echo renderChart("../../FusionCharts/Column3D.swf", "", $strXML, "", 600,300, 0, 0);
?>
<BR><BR>
<a href='../NoChart.html' target="_blank">Unable to see the chart above?</a>
</CENTER>
</BODY>
</HTML>
Tag : PHP, MySQL
|
|
|
 |
 |
 |
 |
| Date :
2015-05-14 06:50:20 |
By :
Nunii |
View :
9049 |
Reply :
11 |
|
 |
 |
 |
 |
|
|
|
|
 |
 |
|
 |
 |
 |
|
|
 |
 |
|
แนะนำโค้ดใหม่ ให้ก็ได้ครับ ช่วยที คับ
|
 |
 |
 |
 |
| Date :
2015-05-14 14:45:23 |
By :
Nunii |
|
 |
 |
 |
 |
|
|
 |
 |
|
 |
 |
 |
|
|
 |
 |
|
ใช้ Google Chart ก็สวยนะครับ
Demo : http://output.jsbin.com/poyudu/1/
Code (PHP)
<html>
  <head>
    <script type="text/javascript" src="https://www.google.com/jsapi"></script>
    <script type="text/javascript">
      google.load("visualization", "1.1", {packages:["bar"]});
      google.setOnLoadCallback(drawChart);
      function drawChart() {
        var data = google.visualization.arrayToDataTable([
          ['รายชื่อ', 'Score1', 'Score2' ],
          ['นาย A', 650, 400 ],
          ['นาย B', 750, 460 ],
          ['นาย C', 120, 350 ],
          ['นาย D', 64, 540 ]
        ]);

        var options = {
          legend: { position: 'none' },
           width: 650,
           height: 350,
          chart: {
            title: 'กราฟสรุปผลแบบทดสอบ',
            subtitle: 'กราฟแท่งแสดงผลคะแนนแต่ละคน',
          }
        };

        var chart = new google.charts.Bar(document.getElementById('deawxchart'));
        chart.draw(data, options);
      }
    </script>
  </head>
  <body>
    <div id="deawxchart" style="width: 900px; height: 500px;"></div>
  </body>
</html>
|
 |
 |
 |
 |
| Date :
2015-05-14 15:12:24 |
By :
deawx |
|
 |
 |
 |
 |
|
|
 |
 |
|
 |
 |
 |
|
|
 |
 |
|
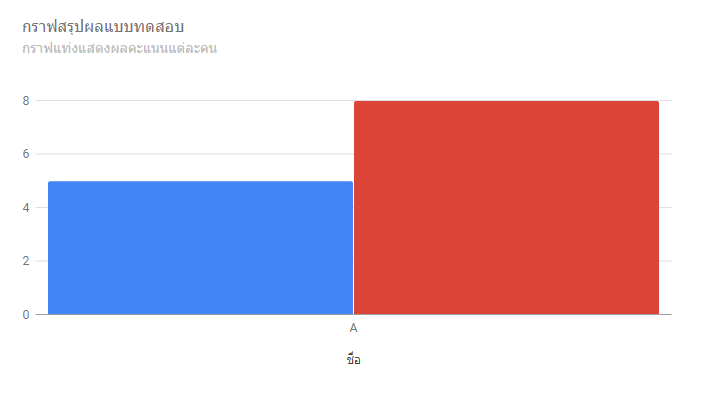
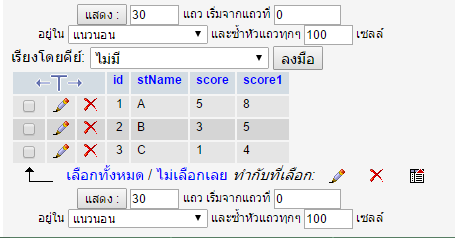
ออกมาเป็นแบบนี้อะครับออกมาคนเดียว ต้องการให้แสดงคนต่อไปเรื่อยๆอะครับ
Code (PHP)
<html>
  <head>
<?php
mysql_query("SET NAMES UTF8");
include("dbInfo.php");
$cid = mysql_connect($host, $usr, $pwd);
mysql_select_db($db);
$sql = "SELECT * FROM score ORDER BY id desc LIMIT 0,100";
$result = mysql_query($sql) or die("Couldn't execute query");
while ($row= mysql_fetch_array($result)) {
$idx += 1;
$stName = $row["stName"];
$score  = $row["score"];
$score1 = $row["score1"];

}
?>

    <script type="text/javascript" src="https://www.google.com/jsapi"></script>
    <script type="text/javascript">
      google.load("visualization", "1.1", {packages:["bar"]});
      google.setOnLoadCallback(drawChart);
      function drawChart() {
        var data = google.visualization.arrayToDataTable([
          ['ชื่อ', 'คะแนนแบบทดสอบก่อนเรียน', 'คะแนนแบบทดสอบหลังเรียน' ],

          <?php
            for($i=0;$i<count($stName);$i++){
              echo "['".$stName[$i]."',".$score[$i].",".$score1[$i]."],";

            }
          ?>

        ]);

        var options = {
          legend: { position: 'none' },
           width: 650,
           height: 350,
          chart: {
            title: 'กราฟสรุปผลแบบทดสอบ',
            subtitle: 'กราฟแท่งแสดงผลคะแนนแต่ละคน',
          }
        };

        var chart = new google.charts.Bar(document.getElementById('deawxchart'));
        chart.draw(data, options);
      }
    </script>
  </head>
  <body>

    <div id="deawxchart" style="width: 200px; height: 100px;"></div>
  </body>
</html>
|
 |
 |
 |
 |
| Date :
2015-05-14 17:12:29 |
By :
Nunii |
|
 |
 |
 |
 |
|
|
 |
 |
|
 |
 |
 |
|
|
 |
 |
|
Code (PHP)
<html>
  <head>
<?php
mysql_query("SET NAMES UTF8");
include("dbInfo.php");
$cid = mysql_connect($host, $usr, $pwd);
mysql_select_db($db);
$sql = "SELECT * FROM score ORDER BY id desc LIMIT 0,100";
$result = mysql_query($sql) or die("Couldn't execute query");

?>

    <script type="text/javascript" src="https://www.google.com/jsapi"></script>
    <script type="text/javascript">
      google.load("visualization", "1.1", {packages:["bar"]});
      google.setOnLoadCallback(drawChart);
      function drawChart() {
        var data = google.visualization.arrayToDataTable([
          ['ชื่อ', 'คะแนนแบบทดสอบก่อนเรียน', 'คะแนนแบบทดสอบหลังเรียน' ],

  <?php
while ($row= mysql_fetch_array($result)) {
?>
          ['<?=$row["stName"]?>', <?=$row["score"]?>, <?=$row["score1"]?>],
 <?php
            }
          ?>

        ]);

        var options = {
          legend: { position: 'none' },
           width: 650,
           height: 350,
          chart: {
            title: 'กราฟสรุปผลแบบทดสอบ',
            subtitle: 'กราฟแท่งแสดงผลคะแนนแต่ละคน',
          }
        };

        var chart = new google.charts.Bar(document.getElementById('deawxchart'));
        chart.draw(data, options);
      }
    </script>
  </head>
  <body>

    <div id="deawxchart" style="width: 200px; height: 100px;"></div>
  </body>
</html>
|
 |
 |
 |
 |
| Date :
2015-05-14 19:33:01 |
By :
deawx |
|
 |
 |
 |
 |
|
|
 |
 |
|
 |
 |
 |
|
|
 |
 |
|
ได้แล้วครับ ขอบคุณมากๆเลยครับ ที่สละเวลาส่วนตัว มาแก้โค้ดให้ผม ขอบคุณครับ
|
 |
 |
 |
 |
| Date :
2015-05-14 20:01:23 |
By :
Nunii |
|
 |
 |
 |
 |
|
|
 |
 |
|
 |
 |
 |
|
|
 |
 |
|
บ่เป็นหยังค้าบ ยินดีค้าบ 
|
 |
 |
 |
 |
| Date :
2015-05-15 07:51:02 |
By :
deawx |
|
 |
 |
 |
 |
|
|
 |
 |
|
 |
 |
 |
|
|
 |
 |
|

|
 |
 |
 |
 |
| Date :
2015-05-15 09:35:50 |
By :
nirunsu |
|
 |
 |
 |
 |
|
|
 |
 |
|
 |
 |
 |
|
|
 |
 |
|

|
 |
 |
 |
 |
| Date :
2015-05-15 09:58:00 |
By :
mr.win |
|
 |
 |
 |
 |
|
|
 |
 |
|
 |
 |
 |
|
|
 |
 |
|
ทำกราฟ ใน localhost แสดงปกติ แต่ๆๆๆพอ อัปขึ้น host ทำไมไม่แสดงอ่ะครับ
|
 |
 |
 |
 |
| Date :
2020-01-14 13:38:48 |
By :
hideonbush |
|
 |
 |
 |
 |
|
|
 |
 |
|
 |
 |
 |
|
|
 |
 |
|
สวัดดีครับ
|
 |
 |
 |
 |
| Date :
2020-08-15 09:12:28 |
By :
Manin |
|
 |
 |
 |
 |
|
|
 |
 |
|
 |
 |
 |
|
|
 |
 |
|
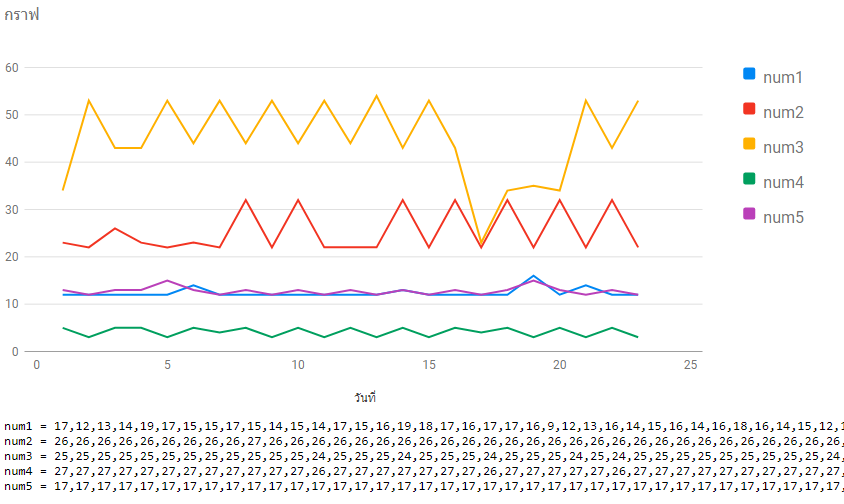
ขอความช่วยเหลือหน่อยครับ
พอดีผมต้องการ พอร์ตกราฟจากไฟล์ txt จากการคัดแยกตัวเลขมาแล้วครับ ด้วย PHP ครับ
อยากนำค่าที่อยู่ใน $num18 $num19 $num20 $num21 $num22 มาพอร์ตกรฟ ครับ
<!doctype html>
<html>
<head>
<meta charset="utf-8">
<title>เซ็ค</title>
</head>
<body>
<?PHP
$file="C:\Users\\1000273853\Desktop\\datatest.txt"; //อ่านจากไฟล์txt
$num1=$num2=$num3=$num4=$num5=$num6=$num7=$num8=$num9=$num10=$num11=$num12=$num13=$num14=$num15=$num16=$num17=$num18=$num19=$num20=$num21=$num22=$num23=$num24=$num25= array(); //สร้างที่เก็บ array
$file_array=file($file);//อ่านไฟล์เข้ามา
$i = 0;
$strnum ="";
foreach ($file_array as $mini){//อ่านทีละบรรทัด
//$strnum.="[".$mini[$num1].",".$mini[$num18]."],";
list($num1[$i],$num2[$i],$num3[$i],$num4[$i],$num5[$i],$num6[$i],$num7[$i],$num8[$i],$num9[$i],$num10[$i],$num11[$i],$num12[$i],$num13[$i],$num14[$i],$num15[$i],$num16[$i],$num17[$i],$num18[$i],$num19[$i],$num20[$i],$num21[$i],$num22[$i],$num23[$i],$num24[$i],$num25[$i]) = explode(',', substr($mini,0)); //กำหนดบรรทัด array
$num1[$i] = intval(substr($num1[$i],8));
$num18[$i] = intval($num18[$i]);
$num19[$i] = intval($num19[$i]);
$num20[$i] = intval($num20[$i]);
$num21[$i] = intval($num21[$i]);
$num22[$i] = intval($num22[$i]);
//echo "<pre>";
//echo "num1 = " ; echo intval($num18[$i]); echo "<td>,";
//echo "num2 = " ; echo intval($num19[$i]); echo "<td>,";
//echo "num3 = " ; echo intval($num20[$i]); echo "<td>,";
//echo "num4 = " ; echo intval($num21[$i]); echo "<td>,";
//echo "num5 = " ; echo intval($num22[$i]); echo "</pre>";
$i++;
}
?>
<script type="text/javascript" src="https://www.gstatic.com/charts/loader.js"></script>
<script type="text/javascript">
google.charts.load('current', {'packages':['line']});
google.charts.setOnLoadCallback(drawChart);
function drawChart() {
var data = new google.visualization.DataTable();
data.addColumn('number', 'วันที่');
data.addColumn('number', 'num1');
data.addColumn('number', 'num2');
data.addColumn('number', 'num3');
data.addColumn('number', 'num4');
data.addColumn('number', 'num5');
data.addRows([
[1,12,23,34,5,13],
[2,12,22,53,3,12],
[3,12,26,43,5,13],
[4,12,23,43,5,13],
[5,12,22,53,3,15],
[6,14,23,44,5,13],
[7,12,22,53,4,12],
[8,12,32,44,5,13],
[9,12,22,53,3,12],
[10,12,32,44,5,13],
[11,12,22,53,3,12],
[12,12,22,44,5,13],
[13,12,22,54,3,12],
[14,13,32,43,5,13],
[15,12,22,53,3,12],
[16,12,32,43,5,13],
[17,12,22,23,4,12],
[18,12,32,34,5,13],
[19,16,22,35,3,15],
[20,12,32,34,5,13],
[21,14,22,53,3,12],
[22,12,32,43,5,13],
[23,12,22,53,3,12]
]);
var options = {
chart: {
title: 'กราฟ',
},
width: 800,
height: 400,
axes: {
x: {
0: {side: 'button'}
}
}
};
var chart = new google.charts.Line(document.getElementById('line_top_x'));
chart.draw(data, google.charts.Line.convertOptions(options));
}
</script>
</head>
<body>
<div id="line_top_x"></div>
</body>
<?php
$file = fopen('C:\Users\\1000273853\Desktop\\text.txt','w+') or die("Unable to open file!");
$str = implode(',', $num18);
fwrite($file,$str);
fclose($file);
unset($file_array) ; echo '<pre>'; //กำหนดแสดง
echo 'num0 = '; echo implode(',', $num1); echo '<br>';
echo 'num1 = '; echo implode(',', $num18); echo '<br>';
echo 'num2 = '; echo implode(',', $num19); echo '<br>';
echo 'num3 = '; echo implode(',', $num20); echo '<br>';
echo 'num4 = '; echo implode(',', $num21); echo '<br>';
echo 'num5 = '; echo implode(',', $num22); echo '</pre>';
?>
</html>
|
 |
 |
 |
 |
| Date :
2020-08-15 09:25:37 |
By :
Manin |
|
 |
 |
 |
 |
|
|
 |
 |
|
 |
 |
|
|