 |
สอบถามเกี่ยวกับ JPgraph หน่อยครับ ผมติดปัญหา กราฟ ไม่ขึ้นครับ |
| |
 |
|
|
 |
 |
|
สอบถามเรื่องเกี่ยวกับ เขียน JPgraph หน่อยครับ ผมติดปัญหากราฟไม่ขึ้นครับผม มันขึ้นแบบ นี้ครับ ขอคำแนะนำด้วยครับ
Error
JpGraph Error: 25067 Your manually specified scale and ticks is not correct. The scale seems to be too small to hold any of the specified tick marks.
Code (PHP)
 <?php // content="text/plain; charset=utf-8"
include ('jpgraph/src/jpgraph.php');
include ('jpgraph/src/jpgraph_bar.php');

$objConnect = mysql_connect("localhost","root","root") or die("Error Connect to Database");
$objDB = mysql_select_db("libedb");
$strSQL = "SELECT count(test_in) from check_in";
$objQuery = mysql_query($strSQL) or die ("Error Query [".$strSQL."]");

// เตรียมข้อมุลที่จะแสดง เพื่อสร้างกราฟ
$datay=array();
while($objResult = mysql_fetch_array($objQuery))
{
$data[] = $objResult["test_in"];
}

// Create the graph. These two calls are always required
$graph = new Graph(350,220,'auto');
$graph->SetScale("textlin");

//$theme_class="DefaultTheme";
//$graph->SetTheme(new $theme_class());

// set major and minor tick positions manually
$graph->yaxis->SetTickPositions(array(0,30,60,90,120,150), array(15,45,75,105,135));
$graph->SetBox(false);

//$graph->ygrid->SetColor('gray');
$graph->ygrid->SetFill(false);
$graph->xaxis->SetTickLabels(array('A','B','C','D'));
$graph->yaxis->HideLine(false);
$graph->yaxis->HideTicks(false,false);

// Create the bar plots
$b1plot = new BarPlot($datay);

// ...and add it to the graPH
$graph->Add($b1plot);


$b1plot->SetColor("white");
$b1plot->SetFillGradient("#4B0082","white",GRAD_LEFT_REFLECTION);
$b1plot->SetWidth(45);
$graph->title->Set("Bar Gradient(Left reflection)");

// Display the graph
$graph->Stroke();
?>
Tag : PHP
|
ประวัติการแก้ไข
2015-12-16 03:07:43
2015-12-18 14:07:56
|
 |
 |
 |
 |
| Date :
2015-12-15 23:05:20 |
By :
keng.l3uu |
View :
1333 |
Reply :
10 |
|
 |
 |
 |
 |
|
|
|
|
 |
 |
|
 |
 |
 |
|
|
 |
 |
|

|
ประวัติการแก้ไข
2015-12-16 03:08:44
 |
 |
 |
 |
| Date :
2015-12-16 00:30:53 |
By :
keng.l3uu |
|
 |
 |
 |
 |
|
|
 |
 |
|
 |
 |
 |
|
|
 |
 |
|
Code (PHP)
print_r($datay);
ดูตัวนี้มันมีค่าอะไรบ้างครับ
|
 |
 |
 |
 |
| Date :
2015-12-16 10:18:02 |
By :
mr.win |
|
 |
 |
 |
 |
|
|
 |
 |
|
 |
 |
 |
|
|
 |
 |
|
.
|
ประวัติการแก้ไข
2015-12-16 12:44:04
 |
 |
 |
 |
| Date :
2015-12-16 12:43:02 |
By :
keng.l3uu |
|
 |
 |
 |
 |
|
|
 |
 |
|
 |
 |
 |
|
|
 |
 |
|
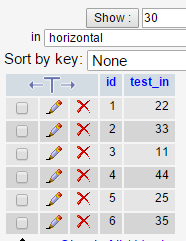
พี่วินครับ คือผมจะให้ มันแสดงผลรวมของการ scan อ่ะครับ ข้อมูลที่เก็บก็จะมี test_in. user_id , และก็ datenow
|
 |
 |
 |
 |
| Date :
2015-12-16 15:51:22 |
By :
keng.l3uu |
|
 |
 |
 |
 |
|
|
 |
 |
|
 |
 |
 |
|
|
 |
 |
|
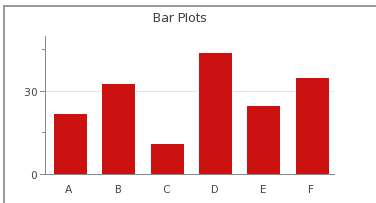
ลองดูครับ
Code (PHP)
DB TEST


เรียกกราฟมาแสดง
<iframe src="JpGraph.php" height="600" width="700" ></iframe>
ข้อมูกราฟ
Code (PHP)
<?php // content="text/plain; charset=utf-8"
require_once ('jpgraph/src/jpgraph.php');
require_once ('jpgraph/src/jpgraph_bar.php');

$objConnect = mysql_connect("localhost","root","1234") or die("Error Connect to Database");
$objDB = mysql_select_db("JpGraph");
$strSQL = "select * from check_in";
$objQuery = mysql_query($strSQL);
$data = array();
while($result = mysql_fetch_array($objQuery))
{
	$data []=$result["test_in"];
}


// Create the graph. These two calls are always required
$graph = new Graph(350,200,'auto');
$graph->SetScale("textlin");

$theme_class=new UniversalTheme;
$graph->SetTheme($theme_class);

$graph->yaxis->SetTickPositions(array(0,30,60,90,120,150), array(15,45,75,105,135));
$graph->SetBox(false);

$graph->ygrid->SetFill(false);
$graph->xaxis->SetTickLabels(array('A','B','C','D','E','F'));
$graph->yaxis->HideLine(false);
$graph->yaxis->HideTicks(false,false);

// Create the bar plots
$b1plot = new BarPlot($data);


// Create the grouped bar plot
$gbplot = new GroupBarPlot(array($b1plot));
// ...and add it to the graPH
$graph->Add($gbplot);


$b1plot->SetColor("white");
$b1plot->SetFillColor("#cc1111");


$graph->title->Set("Bar Plots");

// Display the graph
$graph->Stroke();
?>
|
 |
 |
 |
 |
| Date :
2015-12-16 21:48:33 |
By :
banditt |
|
 |
 |
 |
 |
|
|
 |
 |
|
 |
 |
 |
|
|
 |
 |
|

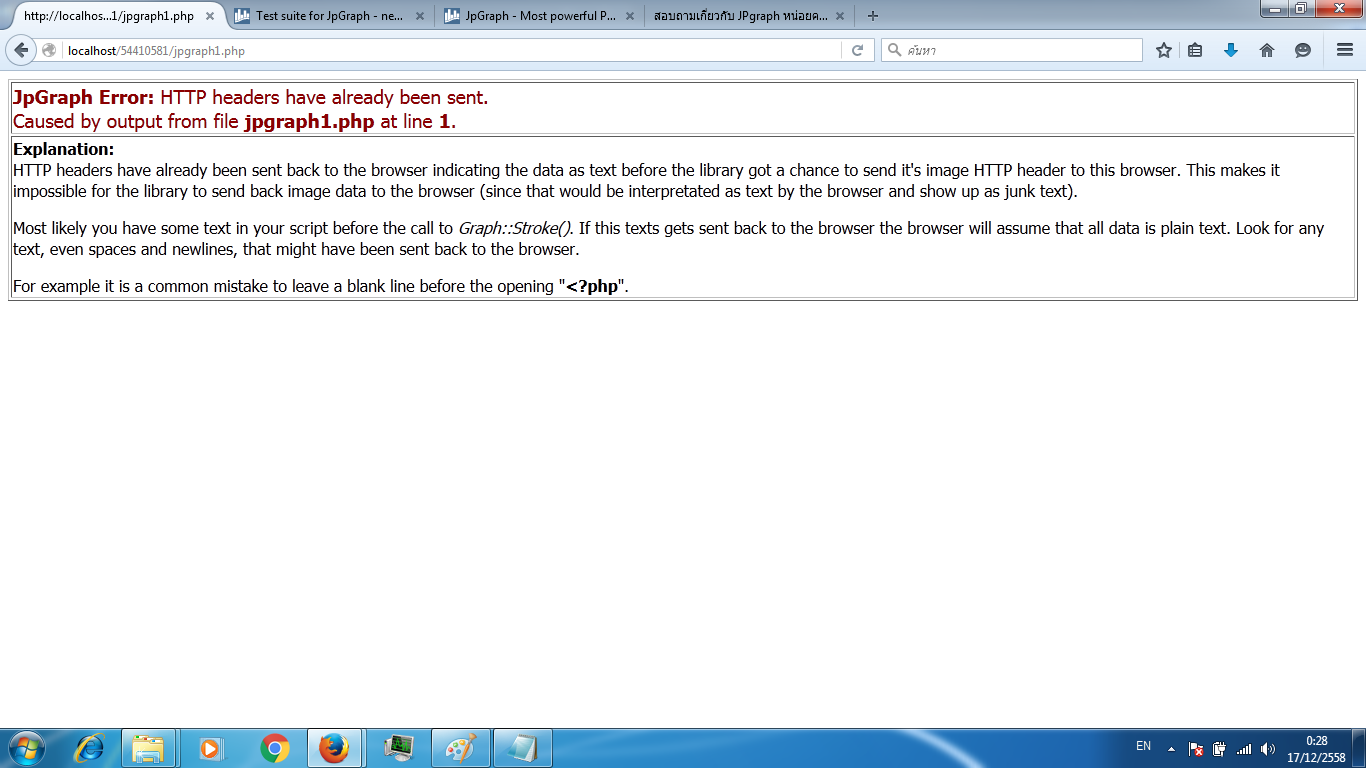
สอบถามหน่อยครับ ถ้ามันขึ้นแบบนี้มีวิธีแก้ไขไหมครับ
|
 |
 |
 |
 |
| Date :
2015-12-17 00:29:37 |
By :
keng.l3uu |
|
 |
 |
 |
 |
|
|
 |
 |
|
 |
 |
 |
|
|
 |
 |
|
ขอบพระคุณครับบ ขึ้นแล้ว
|
ประวัติการแก้ไข
2015-12-17 01:48:44
 |
 |
 |
 |
| Date :
2015-12-17 01:45:37 |
By :
keng.l3uu |
|
 |
 |
 |
 |
|
|
 |
 |
|
 |
 |
 |
|
|
 |
 |
|
สรุปเป็นเพราะอะไรครับ
|
 |
 |
 |
 |
| Date :
2015-12-17 15:01:06 |
By :
mr.win |
|
 |
 |
 |
 |
|
|
 |
 |
|
 |
 |
 |
|
|
 |
 |
|
// เตรียมข้อมุลที่จะแสดง เพื่อสร้างกราฟ
$datay=array();
while($objResult = mysql_fetch_array($objQuery))
{
$data[] = $objResult["test_in"];
}
ตรง $data[] ครับ กะตรงสวนกราฟ บรรทัดที่ 35 $b1plot = new BarPlot($datay);
y ตัวเดียวปัญหาเกิดครับ = = ตอนนี้มาติดปัญหากราฟเส้นและครับ ยังไงก็ขอบคุณครับพี่วิน และอื่นๆ
|
 |
 |
 |
 |
| Date :
2015-12-18 15:59:06 |
By :
keng.l3uu |
|
 |
 |
 |
 |
|
|
 |
 |
|
 |
 |
 |
|
|
 |
 |
|
มาติดปัญหา กราฟ เส้น แสดงแบบเดียวกับ comment ที่ No. 6 ครับ   
|
 |
 |
 |
 |
| Date :
2015-12-18 16:00:24 |
By :
keng.l3uu |
|
 |
 |
 |
 |
|
|
 |
 |
|
 |
 |
|
|