 |
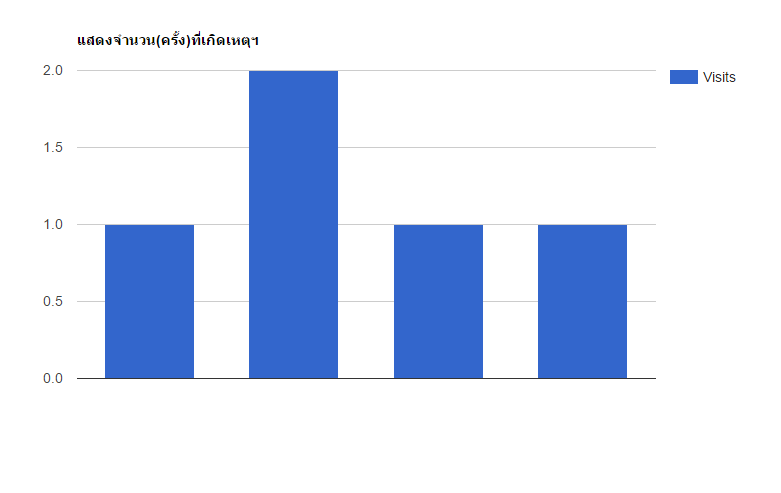
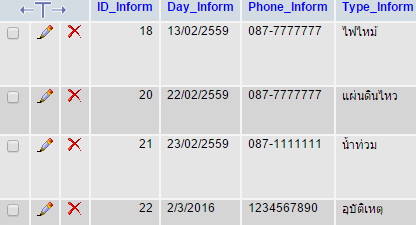
สอบถามค่ะ สามารถดึงข้อมูลจากฐานข้อมูลมาทำเป็นกราฟได้ไหมคะphp |
| |
 |
|
|
 |
 |
|
ขอดู Code ที่ใช้สำหรับการ แสดงกราฟหน่อยครับ
|
 |
 |
 |
 |
| Date :
2016-03-09 17:52:10 |
By :
mr.win |
|
 |
 |
 |
 |
|
|
 |
 |
|
 |
 |
 |
|
|
 |
 |
|
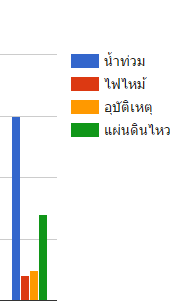
กราฟขึ้นแล้วค่ะ^_^
แต่ไม่มีข้อความแสดงบอกประเภทและจำนวนครั้งด้านหน้ากราฟค่ะ ต้องเพิ่มตรงไหนหรือเปล่าคะ

ต้องการบอกประเภทตามฐานข้อมูลค่ะ


โค๊ดค่ะ
Code (PHP)
<?php
	$con = mysqli_connect('localhost','root','1234','swiftcodin_ens');
?>
<!DOCTYPE HTML>
<html>
<head>
	<meta charset="utf-8">
	<title>
		แผนภูมิ
	</title>
	<script type="text/javascript" src="https://www.google.com/jsapi"></script>
	<script type="text/javascript">
    google.load("visualization", "1", {packages:["corechart"]});
    google.setOnLoadCallback(drawChart);
    function drawChart() {
      var data = google.visualization.arrayToDataTable([

         ['Type_Inform', 'Visits'],
         <?php
	        	$query = "SELECT count(Type_Inform) AS count FROM addinform GROUP BY Type_Inform ORDER BY Type_Inform";

	        	$exec = mysqli_query($con,$query);
	        	while($row = mysqli_fetch_array($exec)){

	        		echo "['".$row['Type_Inform']."',".$row['count']."],";
	        	}
	       ?>

      ]);

        var options = {
        	title: 'แสดงจำนวน(ครั้ง)ที่เกิดเหตุฯ'
        };
      var chart = new google.visualization.ColumnChart(document.getElementById("columnchart"));
      chart.draw(data, options);
  }
  </script>
</head>
<body>
   <h3>Column Chart</h3>
   <div id="columnchart" style="width: 900px; height: 500px;"></div>
</body>
</html>
|
 |
 |
 |
 |
| Date :
2016-03-09 20:53:12 |
By :
biwty |
|
 |
 |
 |
 |
|
|
 |
 |
|
 |
 |
|
|