 |
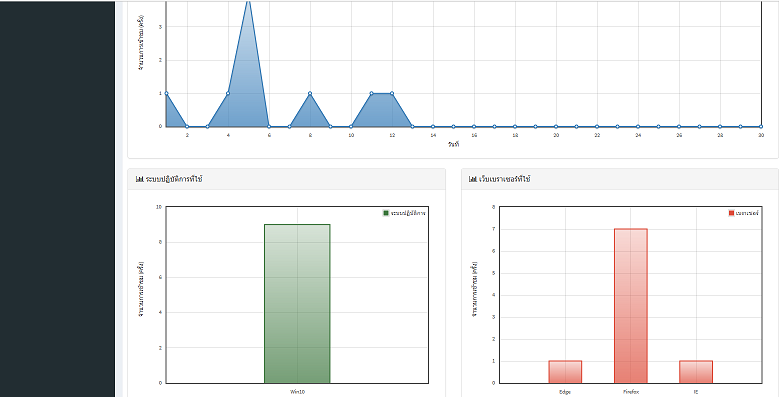
มีใครรับทำกราฟเพื่อแสดงบนหน้าเว็บบ้างไหมค่ะ งานด่วนค่ะ |
| |
 |
|
|
 |
 |
|
flot chart

Code (JavaScript)
$(document).ready(function () {
var init_date = moment($('#datepicker').find("input").val(), "YYYY-MM");
$(".display-month").html(thai_date(init_date));
$(".ajax-loading").css("display", "none");
detail_statistic(init_date);
chart_statistic(init_date, "website");
$('#chart a[data-toggle="tab"]').on('shown.bs.tab', function (e) {
var selected_date = moment($('#datepicker').find("input").val(), "YYYY-MM")
$.fn.dataTable.tables({ visible: true, api: true }).columns.adjust();
switch ($(e.target).attr("href")) {
default:
chart_statistic(selected_date, "website");
break;
case "#webapp":
chart_statistic(selected_date, "webapp");
break;
case "#mobileapp":
chart_statistic(selected_date, "mobileapp");
break;
}
});
$('#datepicker').datetimepicker({
viewMode: 'months',
format: 'YYYY-MM'
}).on("dp.change", function (e) {
$('.display-month').html(thai_date(e.date));
detail_statistic(e.date);
switch ($("ul.nav-tabs li.active a").attr("href")) {
default:
chart_statistic(e.date, "website");
break;
case "#webapp":
chart_statistic(e.date, "webapp");
break;
case "#mobileapp":
chart_statistic(e.date, "mobileapp");
break;
}
});
});
function chart_statistic(date, tab) {
$.ajax({
dataType: 'json',
url: '/ajax/statistic_chart',
type: 'get',
cache: false,
data: {
'date': date.format("YYYY-M-D"),
'web': tab
},
beforeSend: function () {
$(".ajax-loading").css("display", "block");
},
success: function (data) {
$(".ajax-loading").css("display", "none");
var dataset_visitor = [{ label: " " + ((tab == "webapp") ? "เจ้าหน้าที่" : "ผู้เข้าชม"), data: data.visitors, color: "#337ab7" }];
var options_visitor = options_line_chart();
$.plot($("#visitor-" + tab + "-flot-line-chart"), dataset_visitor, options_visitor);
$("<div class='axisLabel xaxisLabel'></div>").text("วันที่").appendTo($("#visitor-" + tab + "-flot-line-chart"));
$("<div class='axisLabel yaxisLabel'></div>").text((tab != "website") ? "จำนวนการเข้าในงานระบบ (ครั้ง)" : "จำนวนการเข้าชม (ครั้ง)").appendTo($("#visitor-" + tab + "-flot-line-chart"))
.css("margin-top", $("<div class='axisLabel yaxisLabel'></div>").width() / 2 - 20);
if (tab != 'mobileapp') {
var dataset_platform = [{ label: " ระบบปฏิบัติการ", data: data.platforms[0], color: "#3c763d" }];
var optiond_platform = options_bar_chart(data.platforms[1], data.platforms[0].length);
$.plot($("#platform-" + tab + "-flot-bar-chart"), dataset_platform, optiond_platform);
$("<div class='axisLabel yaxisLabel'></div>").text((tab == "webapp") ? "จำนวนการเข้าในงานระบบ (ครั้ง)" : "จำนวนการเข้าชม (ครั้ง)").appendTo($("#platform-" + tab + "-flot-bar-chart"))
.css("margin-top", $("<div class='axisLabel yaxisLabel'></div>").width() / 2 - 20);
var dataset_browser = [{ label: " เบราเซอร์", data: data.browsers[0], color: "#dd4b39" }];
var optiond_browser = options_bar_chart(data.browsers[1], data.browsers[0].length);
$.plot($("#browser-" + tab + "-flot-bar-chart"), dataset_browser, optiond_browser);
$("<div class='axisLabel yaxisLabel'></div>").text((tab == "webapp") ? "จำนวนการเข้าในงานระบบ (ครั้ง)" : "จำนวนการเข้าชม (ครั้ง)").appendTo($("#browser-" + tab + "-flot-bar-chart"))
.css("margin-top", $("<div class='axisLabel yaxisLabel'></div>").width() / 2 - 20);
}
}
});
}
function options_line_chart() {
var options = {
series: {
lines: {
show: true,
fill: true,
fillColor: {
colors: [
{ opacity: 0.7 },
{ opacity: 0.1 }
]
}
},
points: { show: true }
},
legend: {
noColumns: 0,
position: "ne"
},
grid: {
hoverable: true, //IMPORTANT! this is needed for tooltip to work
minBorderMargin: 20,
labelMargin: 10,
margin: {
top: 0,
bottom: 20,
left: 20
}
},
xaxis: {
labelWidth: 30,
tickDecimals: 0,
minTickSize: 1
},
yaxis: {
min: 0,
labelWidth: 30,
tickDecimals: 0,
minTickSize: 1
},
tooltip: true,
tooltipOpts: {
content: customTooltip
}
};
return options;
}
function options_bar_chart(ticks, length) {
var options = {
series: {
bars: {
show: true,
fill: true,
fillColor: {
colors: [
{ opacity: 0.2 },
{ opacity: 0.7 }
]
}
}
},
bars: {
align: "center",
barWidth: 0.5
},
legend: {
noColumns: 0,
position: "ne"
},
grid: {
hoverable: true, //IMPORTANT! this is needed for tooltip to work
minBorderMargin: 20,
labelMargin: 10,
margin: {
top: 0,
bottom: 0,
left: 20
}
},
xaxis: {
min: 0,
max: length + 1,
labelWidth: 30,
tickDecimals: 0,
minTickSize: 1,
ticks: ticks
},
yaxis: {
min: 0,
labelWidth: 30,
tickDecimals: 0,
minTickSize: 1
},
tooltip: true,
tooltipOpts: {
content: "%x: %y ครั้ง"
}
};
return options;
}
function detail_statistic(date) {
$('#dataTables-website').dataTable().fnDestroy();
$('#dataTables-website').dataTable({
"ajax": {
"url": "/ajax/statistic_detail",
"type": "get",
"data": {
"date": date.format("YYYY-M-D"),
"web": "website"
}
}
});
$('#dataTables-webapp').dataTable().fnDestroy();
$('#dataTables-webapp').dataTable({
"ajax": {
"url": "/ajax/statistic_detail",
"type": "get",
"data": {
"date": date.format("YYYY-M-D"),
"web": "webapp"
}
}
});
$('#dataTables-mobileapp').dataTable().fnDestroy();
$('#dataTables-mobileapp').dataTable();
}
function thai_date(date) {
var months = { 'January': 'มกราคม', 'February': 'กุมภาพันธ์', 'March': 'มีนาคม', 'April': 'เมษายน', 'May': 'พฤษภาคม', 'June': 'มิถุนายน', 'July': 'กรกฎาคม', 'August': 'สิงหาคม', 'September': 'กันยายน', 'October': 'ตุลาคม', 'November': 'พฤศจิกายน', 'December': 'ธันวาคม' };
var month = months[date.format("MMMM")];
var year = parseInt(date.format("YYYY"), 10) + 543;
return month + " " + year.toString();
}
function customTooltip(label, x, y) {
return "วันที่ " + x + " จำนวน " + y + " ครั้ง";
}
|
 |
 |
 |
 |
| Date :
2016-04-18 08:31:55 |
By :
ห้ามตอบเกินวันละ 2 กระทู้ |
|
 |
 |
 |
 |
|
|
 |
 |
|
 |
 |
|
|