 |
|
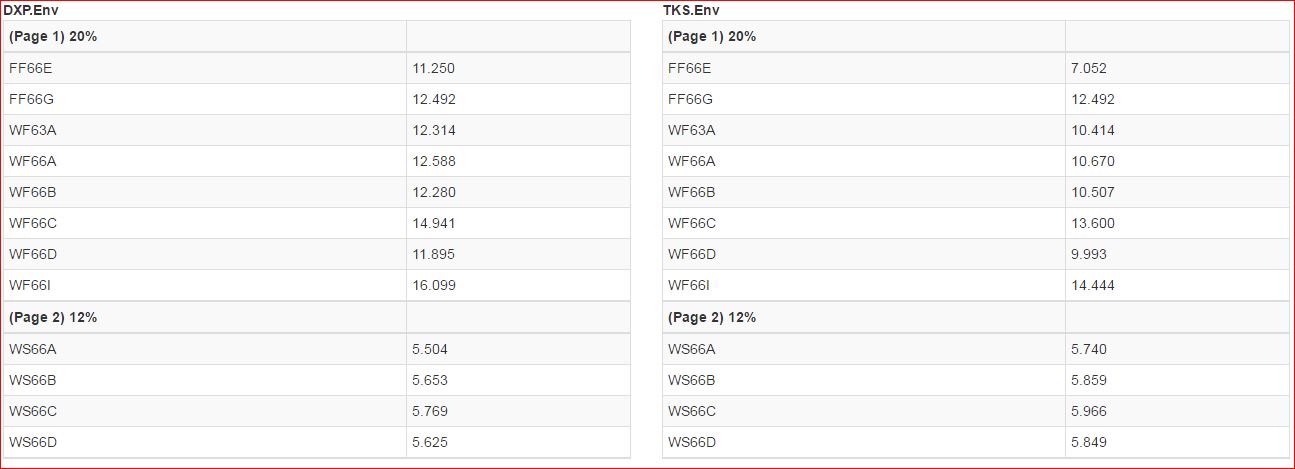
ผมต้องการนำข้อมูลจากตาราง HTML ทั้ง 2 ตาราง มาแสดงใน highcharts ครับ

ตารางซ้าย = datatable1, ตารางขวา = datatable2

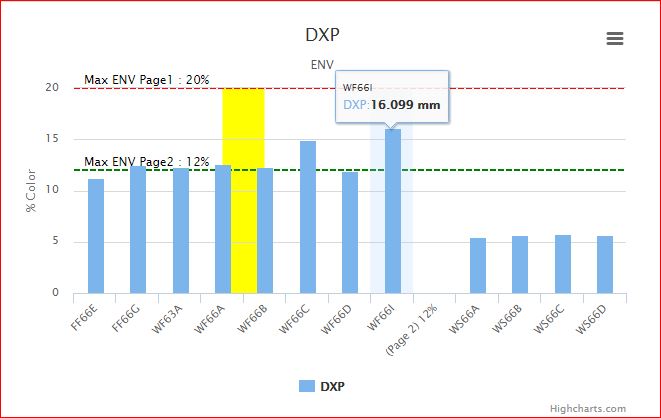
ในภาพนี้ผมสามารถดึง html มาแสดงกราฟได้แค่อันเดียว ผมต้องการไข Code อย่างไรครับ ถึงจะสามารถดึง table html ทั้ง 2 มาแสดงรวมกันได้
Code (Java)
<script>
	$(function () {
		$('#container').highcharts({
			data: {
				table: document.getElementById('datatable1')
			},
			series: [{
                name: 'DXP',
                data: 'datatable1'
			}],
			chart: {
				type: 'column'
			},
			title: {
				text: 'DXP'
			},
			subtitle: {
            text: 'ENV'
            },
			xAxis: {
            categories: [
            ],
            crosshair: true
			,plotBands: [{
    					color: 'yellow', // Color value
    					from: 3, // Start of the plot band
    					to: 4 // End of the plot band
  						}]
        	},
			yAxis: {
				allowDecimals: false,
				title: {
					text: '% Color'
				},plotLines: [{
    					color: 'red', // Color value
    					dashStyle: 'shortdash', // Style of the plot line. Default to solid
    					value: 20, // Value of where the line will appear
    					width: 2,
						label: {text: 'Max ENV Page1 : 20%'} // Width of the line
								},{
    					color: 'green', // Color value
    					dashStyle: 'shortdash', // Style of the plot line. Default to solid
    					value: 12, // Value of where the line will appear
    					width: 2,
						label: {text: 'Max ENV Page2 : 12%'} // Width of the line
								}]
			},
			tooltip: {
            headerFormat: '<span style="font-size:10px">{point.key}</span><table>',
            pointFormat: '<tr><td style="color:{series.color};padding:0">{series.name}: </td>' +
                '<td style="padding:0"><b>{point.y:.3f} mm</b></td></tr>',
            footerFormat: '</table>',
            shared: true,
            useHTML: true
        },
        plotOptions: {
            column: {
                pointPadding: 0.2,
                borderWidth: 0
            }
			}
		});
	});
</script>
Tag : PHP, HTML/CSS, JavaScript, Ajax, jQuery
|
ประวัติการแก้ไข
2016-06-30 18:05:16
|
 |
 |
 |
 |
| Date :
2016-06-30 17:49:50 |
By :
horizon1 |
View :
1490 |
Reply :
2 |
|
 |
 |
 |
 |
|
|
|
|
 |