 |
|
ขอคำแนะนำวิธีใส่ข้อมูลลงใน Google Chart ครับ
พอดีผมไม่ค่อยเก่ง javascript กับพวก array พี่ๆช่วยแนะนำหน่อยครับ ว่าใส่โค้ดยังไงบ้างครับ? ต้องเรียนรู้เรื่องอะไรเพิ่มบ้าง?
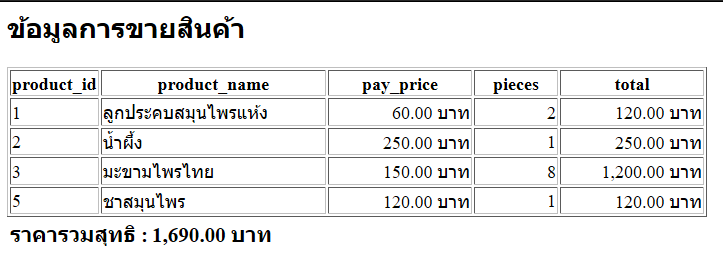
อันนี้ภาพข้อมูลที่ select ออกมาจากตาราง อยากจะใส่ลงใน google chart ครับ

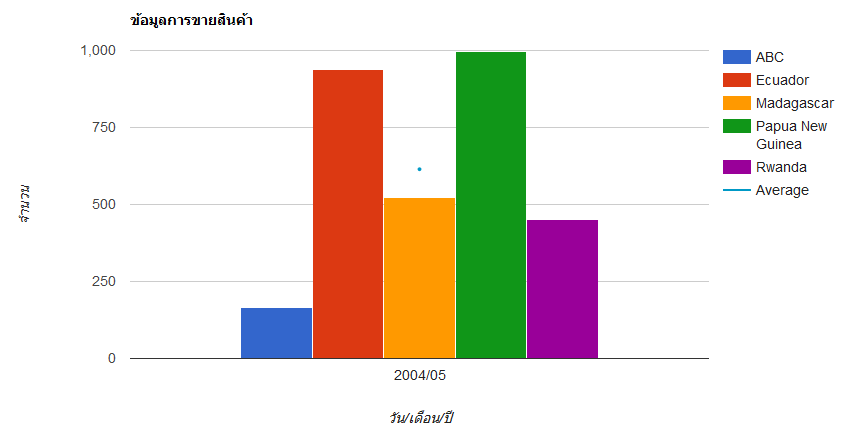
อันนี้ภาพกราฟที่ผมอยากเอาข้อมูลใส่ลงไปครับ

อันนี้เป็นโค้ดที่ใช้ select ตามรูปด้านบนครับ
Code
<?php

function returnCustomer()
{
	$objConnect = mysql_connect("localhost","root","root1234") or die(mysql_error());
	$objDB = mysql_select_db("pajookdb");
	$strSQL = "Select orders.*, SUM(order_details.pieces) AS Sumpieces, order_details.pay_price, products.* From orders, order_details, products Where orders.order_id=order_details.order_id and order_details.product_id=products.product_id and orders.status='3' Group By order_details.product_id Order By products.product_id ASC";
	$objQuery = mysql_query($strSQL) or die (mysql_error());
	$resultArray = array();
	while($obResult = mysql_fetch_array($objQuery))
	{
		array_push($resultArray,$obResult);
	}
	mysql_close($objConnect);
	return $resultArray;
}

$resultCus = returnCustomer();

//echo '<pre>';
//var_dump($resultCus);
//echo '</pre><hr />';

?>

<h2>ข้อมูลการขายสินค้า</h2>
<table width="700" border="1">
  <tr>
    <th width="80"> <div align="center">product_id </div></th>
      <th width=""> <div align="center">product_name </div></th>
          <th width="140"> <div align="center">pay_price </div></th>
    <th width="80"> <div align="center">pieces </div></th>

    <th width="140"> <div align="center">total </div></th>
  </tr>
<?php
foreach ($resultCus as $result)
{
      $SumTotal = 0 ;
      $total_price = 0 ;
      $pieces = $result['pieces'];
      $price = $result['pay_price'];
      $product_name = $result['product_name'];
      $product_id = $result['product_id'];
      $Sumpieces = $result['Sumpieces'];   //ตัวแปรเก็บผลรวมจำนวนชิ้น SUM(order_details.pieces) AS Sumpieces
      $total_price = $price * $Sumpieces;
      $_SESSION["Sumtotal"] = $_SESSION["Sumtotal"] + $total_price; //หาผลราคารวมทั้งหมด
?>
  <tr>
    <td align="left"><?php echo $product_id;?></td>
      <td align="left"><?php echo $product_name;?></td>
        <td align="right"><?php echo $price;?> บาท</td>
    <td align="right"><?php echo $Sumpieces;;?></td>
      <td align="right"><?php echo number_format($total_price,2);?> บาท</td>

  </tr>
<?php
}
?>
    <table class="table">
     <tr>
      <td align="right"><h3> ราคารวมสุทธิ :</h3></td>
      <td><h3><?php echo number_format($_SESSION["Sumtotal"],2);?>  บาท</h3></td>
  </tr>
</table>

<html>
  <head>
    <script type="text/javascript" src="https://www.gstatic.com/charts/loader.js"></script>
    <script type="text/javascript">
      google.charts.load('current', {'packages':['corechart']});
      google.charts.setOnLoadCallback(drawVisualization);


      function drawVisualization() {
        // Some raw data (not necessarily accurate)
        var data = google.visualization.arrayToDataTable([
         ['Monthss', 'ABC', 'Ecuador', 'Madagascar', 'Papua New Guinea', 'Rwanda', 'Average'],
         ['2004/05',  165,      938,         522,             998,           450,      614.6],

      ]);

    var options = {
      title : 'ข้อมูลการขายสินค้า',
      vAxis: {title: 'จำนวน'},
      hAxis: {title: 'วัน/เดือน/ปี'},
      seriesType: 'bars',
      series: {5: {type: 'line'}}
    };

    var chart = new google.visualization.ComboChart(document.getElementById('chart_div'));
    chart.draw(data, options);
  }
    </script>

  </head>
  <body>
    <div id="chart_div" style="width: 900px; height: 500px;"></div>
  </body>
</html>
Tag : PHP, MySQL, HTML/CSS, JavaScript
|
|
|
 |
 |
 |
 |
| Date :
2016-10-27 22:10:06 |
By :
no007 |
View :
1594 |
Reply :
2 |
|
 |
 |
 |
 |
|
|
|
|
 |