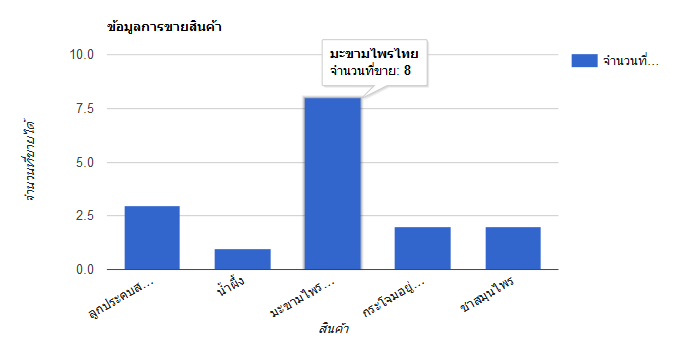
 |
|
ขอสอบถามวิธีทำให้แท่งกราฟ(Google Chart) แต่ละรายการมีสีที่ต่างกัน มีแท่งสีไม่ซ้ำกัน ต้องแก้ไขตรงไหนครับ

Code (PHP)
<?php
include_once("../header.php");

    $search_Date = "";
    $search_Month = "";
    $search_Year = "";

    if(isset($_POST["search_bt"])){

    $search_Year = $_POST["search_Year"];
    $search_Month = $_POST["search_Month"];
    $search_Date = $_POST["search_Date"];
        //echo $search_Date."-".$search_YM;

        if(($search_Date=="")and($search_Month=="")and($search_Year!="")){
            $select = "Select orders.*, SUM(order_details.pieces) AS Sumpieces, order_details.pay_price, products.* From orders, order_details, products Where orders.order_id=order_details.order_id and order_details.product_id=products.product_id and orders.status='3' and DATE_FORMAT(orders.buy_date,'%Y') = '$search_Year' Group By order_details.product_id Order By products.product_id ASC ";
        }elseif(($search_Date=="")and($search_Month!="")and($search_Year!="")){
            $select = "Select orders.*, SUM(order_details.pieces) AS Sumpieces, order_details.pay_price, products.* From orders, order_details, products Where orders.order_id=order_details.order_id and order_details.product_id=products.product_id and orders.status='3' and DATE_FORMAT(orders.buy_date,'%Y-%m') = '$search_Year-$search_Month' Group By order_details.product_id Order By products.product_id ASC ";
        }elseif(($search_Date!="")and($search_Month=="")and($search_Year!="")){
            echo "<script>alert('โปรดกรอกเดือน. ด้วย.')</script>";
            echo "<script>window.location='admin-seller.php'</script>";
        }elseif(($search_Date!="")and($search_Month!="")and($search_Year=="")){
            echo "<script>alert('โปรดกรอกปีค.ศ. ด้วย.')</script>";
            echo "<script>window.location='admin-seller.php'</script>";
        }elseif(($search_Date!="")and($search_Month=="")and($search_Year=="")){
            echo "<script>alert('โปรดกรอกเดือนและปีค.ศ. ด้วย.')</script>";
            echo "<script>window.location='admin-seller.php'</script>";
        }elseif(($search_Date=="")and($search_Month=="")and($search_Year=="")){
            echo "<script>alert('โปรดกรอกรายละเอียดค้นหาก่อน.')</script>";
            echo "<script>window.location='admin-seller.php'</script>";
        }else{
            $select = "Select orders.*, SUM(order_details.pieces) AS Sumpieces, order_details.pay_price, products.* From orders, order_details, products Where orders.order_id=order_details.order_id and order_details.product_id=products.product_id and orders.status='3' and DATE_FORMAT(orders.buy_date,'%Y-%m-%d') = '$search_Year-$search_Month-$search_Date' Group By order_details.product_id Order By products.product_id ASC ";
        }  //SUM(order_details.pieces) AS Sumpieces หาผลรวมลงตัวแปรSumpieces, Group By เรียงข้อมูลซ้ำเหลือแถวเดียว

    }else{

           $select = "Select orders.*, SUM(order_details.pieces) AS Sumpieces, order_details.pay_price, products.* From orders, order_details, products Where orders.order_id=order_details.order_id and order_details.product_id=products.product_id and orders.status='3' Group By order_details.product_id Order By products.product_id ASC ";
      //3table
    }
     unset($_SESSION["Sumtotal"]);

    $result = mysqli_query($link,$select) or die(mysqli_error($link));
 ?>

<script type="text/javascript" src="https://www.gstatic.com/charts/loader.js"></script>
    <script type="text/javascript">
      google.charts.load('current', {'packages':['corechart']});
      google.charts.setOnLoadCallback(drawVisualization);


      function drawVisualization() {
        // Some raw data (not necessarily accurate)
        var data = google.visualization.arrayToDataTable([
          ['สินค้า', 'จำนวนที่ขาย' ],

  <?php
while ($row= mysqli_fetch_array($result)) {
?>
          ['<?php echo $row["product_name"]?>', <?php echo $row["Sumpieces"]?>],
 <?php
            }
          ?>

        ]);

    var options = {
//        width: 650,
//        height: 400,
      title : 'ข้อมูลการขายสินค้า',
      vAxis: {title: 'จำนวนที่ขายได้'},
      hAxis: {title: 'สินค้า'},
      seriesType: 'bars',
      series: {5: {type: 'line'}}
    };

    var chart = new google.visualization.ComboChart(document.getElementById('chart_div'));
    chart.draw(data, options);
  }

    $(window).resize(function(){  //resize
        chart_div();
        });

    </script>

  <div class="col-xs-12 col-sm-12 col-md-12 col-lg-9" style="margin-bottom: 20px;">
     <div id="chart_div" class="chart"></div>
  </div>
Tag : PHP, MySQL, HTML/CSS, JavaScript
|
ประวัติการแก้ไข
2016-11-09 20:30:22
|
 |
 |
 |
 |
| Date :
2016-11-09 20:28:54 |
By :
no007 |
View :
2234 |
Reply :
3 |
|
 |
 |
 |
 |
|
|
|
|
 |