 |
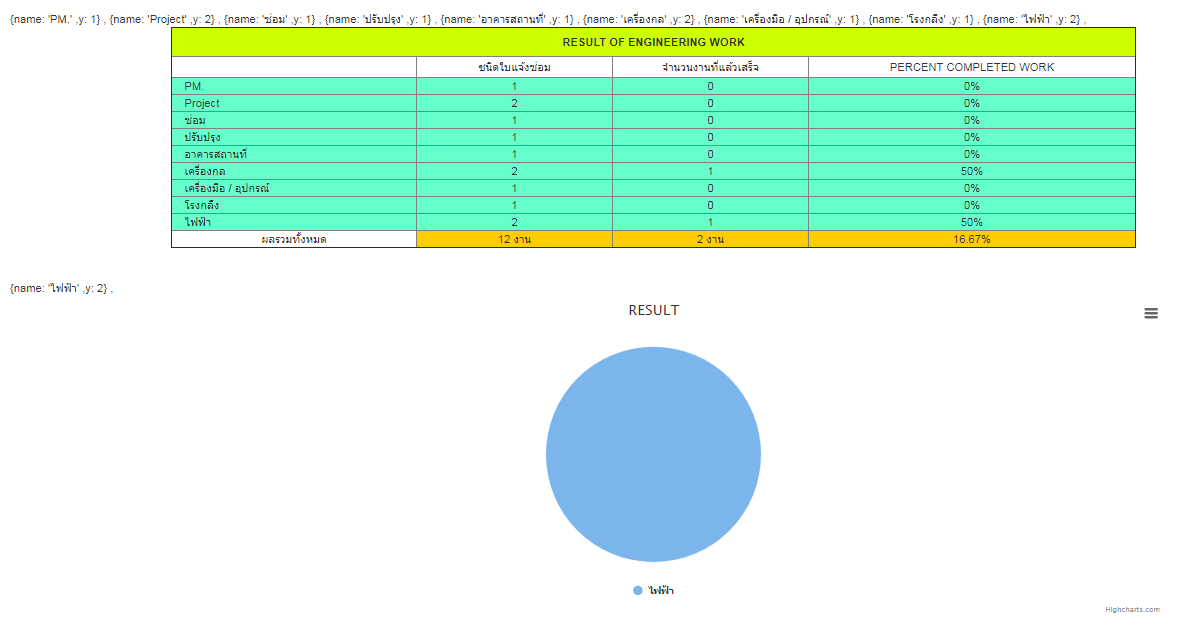
สอบถาม การทำแผนภูมิวงกลม จากตารางที่ดึงข้อมูลมาใช้สรุปผล |
| |
 |
|
|
 |
 |
|
แนะนำตัวนี้ครับ
highcharts
|
 |
 |
 |
 |
| Date :
2018-02-08 09:40:16 |
By :
mongkon.k |
|
 |
 |
 |
 |
|
|
 |
 |
|
 |
 |
 |
|
|
 |
 |
|
ทำไงดีคะ มันมาแค่อย่างเดียว
ลองไปใช้วิธีแบบ https://www.thaicreate.com/php/forum/116475.html แผนภูมิก็ไม่ขึ้นค่ะ 

Code (PHP)
<form name="frmSearch" method="get" action="<?php echo $_SERVER['SCRIPT_NAME'];?>">
<table width="45%" border="0" align="center">
<tr>
<td width="9%" ><i class="icon-calendar"></i> ตั้งแต่</td>
<td width="1%" height="1%"></td>
<td width="9%"><i class="icon-calendar"></i> จนถึง</td>
<td width="1%" ></td>
</tr>
<tr>
<td width="9%"><input type="text" name="datestart" id="dateStart" class="form-control" value="<?php echo $_GET["datestart"];?>"/></td>
<td width="1%"align="center"><strong>to </strong></td>
<td width="9%"><input type="text" name="dateend" id="dateEnd" class="form-control" value="<?php echo $_GET["dateend"];?>"/></td>
<td width="7%" rowspan="2"width="10%" ><button type="submit" name="button" id="button" class="btn btn-success"/>ค้นหา</button></td>
</tr>
</table>
</form>
</br>
<table width="75%" border="1" cellpadding="0" cellspacing="0" align="center" id="datatable">
<tr>
<td height="35" colspan="4" bgcolor="#CCFF00"><div align="center"><strong>RESULT OF ENGINEERING WORK</strong></div></td>
</tr>
<tr>
<td width="15%" height="25" bgcolor="#FFFFFF"><div align="center"> </div></td>
<td width="12%" height="25" bgcolor="#FFFFFF"><div align="center">ชนิดใบแจ้งซ่อม</div></td>
<td width="12%" height="25" bgcolor="#FFFFFF"><div align="center">จำนวนงานที่แล้วเสร็จ</div></td>
<td width="20%" height="25" bgcolor="#FFFFFF"><div align="center">PERCENT COMPLETED WORK</div></td>
</tr>
<?php
if($_GET["datestart"] != "")
{
$objConnect = mysql_connect("localhost","root","password") or die("Error Connect to Database");
$objDB = mysql_select_db("it");
mysql_query("SET NAMES UTF8");
$date_start= $_GET["datestart"];
$date_end= $_GET["dateend"];
$Status="สำเร็จ";
$sql="SELECT * FROM addjob WHERE dateInput BETWEEN '$date_start' AND '$date_end' GROUP BY type_work ";
$dbquery= mysql_query($sql);
$num_rows= mysql_num_rows($dbquery);
$i=0;
$j=0;
while ($i<$num_rows){
$result=mysql_fetch_array($dbquery);
$Type_work =$result['type_work'];
$sql2="SELECT * FROM addjob WHERE type_work = '$Type_work' AND dateInput BETWEEN '$date_start' AND '$date_end' ";
$dbquery2= mysql_query($sql2);
$num_rows2= mysql_num_rows($dbquery2);
$sql3="SELECT * FROM addjob WHERE type_work = '$Type_work' AND status ='$Status' AND dateInput BETWEEN '$date_start' AND '$date_end'";
$dbquery3= mysql_query($sql3);
$num_rows3= mysql_num_rows($dbquery3);
?>
<tr>
<td width="274" align="left" bgcolor="#66FFCC"><?=" $Type_work"?></td>
<td width="210" align="center" bgcolor="#66FFCC"><?=$num_rows2?></td>
<td width="210" align="center" bgcolor="#66FFCC"><?=$num_rows3?></td>
<?php $pc =($num_rows3/$num_rows2)*100 ?>
<?php
$sum_g = "{name: '$Type_work' ,y: $num_rows2} ,";
echo $sum_g;
?>
<td width="210" align="center" bgcolor="#66FFCC"><?="$pc%"?></td>
</tr>
<?php
$sum_numrows+=$num_rows2;
$sum_numrows2+=$num_rows3;
$i++;
$j++;
}
?>
<tr>
<td width="274" align="left" bgcolor="#FFFFFF"><div align="center">ผลรวมทั้งหมด</div></td>
<td width="210" align="center" bgcolor="#FFCC00"><?="$sum_numrows งาน"?></td>
<td width="210" align="center" bgcolor="#FFCC00"><?="$sum_numrows2 งาน"?></td>
<?php
if($sum_numrows2 != ""){
$pc2= ($sum_numrows2/$sum_numrows)*100 ;
$pcf2= round($pc2,2);
}
?>
<td width="210" align="center" bgcolor="#FFCC00"><?="$pcf2%"?></td>
</tr>
<?php
} ?>
</table>
</br></br>
<?php
echo $sum_g; ?>
<div style="width:80%;margin:auto;">
<div id="hc_container" style="min-width: 310px; height: 400px; margin: 0 auto"></div>
</div>
<script src="http://code.highcharts.com/highcharts.js"></script>
<script src="http://code.highcharts.com/modules/exporting.js"></script>
<script type="text/javascript">
$(function () {
$('#hc_container').highcharts({
chart: {
plotBackgroundColor: null,
plotBorderWidth: null,
plotShadow: false,
type: 'pie'
},
title: {
text: 'RESULT'
},
tooltip: {
pointFormat: '{series.name}: <b>{point.percentage:.1f}%</b>'
},
plotOptions: {
pie: {
allowPointSelect: true,
cursor: 'pointer',
dataLabels: {
enabled: false
},
showInLegend: true
}
},
series: [{
name: 'Brands',
colorByPoint: true,
data: [ <?php echo $sum_g?> ]
}]
});
});
</script>
|
ประวัติการแก้ไข
2018-02-08 15:20:36
 |
 |
 |
 |
| Date :
2018-02-08 15:18:04 |
By :
deedy317 |
|
 |
 |
 |
 |
|
|
 |
 |
|
 |
 |
 |
|
|
 |
 |
|
โอเคค่ะ ขอบคุณมากๆค่า
|
 |
 |
 |
 |
| Date :
2018-02-09 07:38:19 |
By :
deedy317 |
|
 |
 |
 |
 |
|
|
 |
 |
|
 |
 |
|
|