 |
|
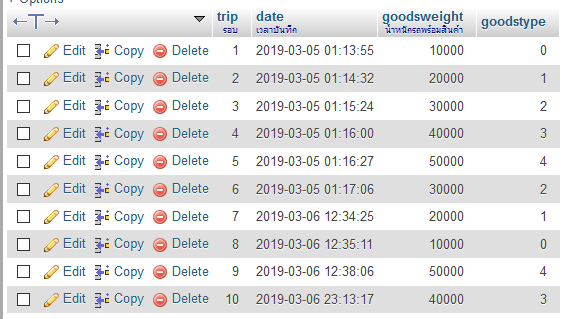
ผมต้องการ แสดง column chart โดยที่
แกน x จะเป็นการไล่ตาม trip กับ date ไปเรือยๆครับ
แกน y จะเป็นนน.หิน ครับ
โดยอยากจะให้แต่ละ trip นั้นแยกให้ด้วยว่า เป็น goodstype อะไรครับ มี 0 1 2 3 4
ช่วยแก้โค้ดให้ทีครับ
Code (PHP)
<?php
//connect ฐานข้อมูล
$host = "localhost";
$user = "root";
$pwd = "123456";
$db = "new";
global $link;
$link = mysql_connect($host,$user,$pwd) or die ("Could not connect to MySQL");
mysql_query("SET NAMES UTF8",$link);
mysql_select_db($db,$link) or die ("Could not select $db database");

  $tripx  = array();

  $ygoodsweight = array();


//sql สำหรับดึงข้อมูล จาก ฐานข้อมูล
$sql = "SELECT showdata.`trip`, showdata.`goodsweight`, showdata.`goodstype`  FROM showdata ";
//จบ sql

$result = mysql_query($sql);
while($row=mysql_fetch_array($result)) {
//array_push คือการนำค่าที่ได้จาก sql ใส่เข้าไปตัวแปร array
 array_push($ygoodsweight,$row["goodsweight"]);
 array_push($tripx,$row["trip"]);      }

?>
<!DOCTYPE HTML>
<html>
 <head>
  <meta http-equiv="Content-Type" content="text/html; charset=utf-8">
  <title>Highcharts Example</title>
        <script type="text/javascript" src="http://ajax.googleapis.com/ajax/libs/jquery/1.7.1/jquery.min.js"></script>
<script src="http://code.highcharts.com/highcharts.js"></script>
<script src="http://code.highcharts.com/modules/exporting.js"></script>
        <script>
 $(function () {
        $('#container').highcharts({
            chart: {
                type: 'column' //รูปแบบของ แผนภูมิ ในที่นี้ให้เป็น line
            },
            title: {
                text: 'จำนวนสินค้า' //
            },
            subtitle: {
                text: ''
            },
            xAxis: {
				title: {
                    text: 'รอบ'
                } ,
                categories: ['<?= implode("','", $tripx); //นำตัวแปร array แกน x มาใส่ ในที่นี้คือ เดือน?>']
            },
            yAxis: {
                title: {
                    text: 'น้ำหนักหิน'
                }
            },
            tooltip: {
                enabled: false,
                formatter: function() {
                    return '<b>'+ this.series.name +'</b><br/>'+
                        this.x +': '+ this.y +'ราย';
                }
            },
   legend: {
                            layout: 'vertical',
                            align: 'right',
                            verticalAlign: 'top',
                            x: -10,
                            y: 100,
                            borderWidth: 0
            },
            plotOptions: {
                line: {
                    dataLabels: {
                        enabled: true
                    },
                    enableMouseTracking: false
                }
            },
            series: [
			{ name: 'ประเภทสินค้า',
                  data: [<?= implode(',', $ygoodsweight) // ข้อมูล array แกน y ?>]
                            }


					]
        });
    });
        </script>
    </head>
    <body>
      <div id="container" style="min-width: 320px; height: 380px; margin: 0 auto"></div>
    </body>
</html>
นี่เป็นdatabase กับ กราฟที่ออกมาครับ
 
อยากให้ออกมาประมานนี้ครับ

รบกวนช่วยดูให้หน่อยครับ
Tag : PHP, MySQL, CSS, JavaScript, XAMPP
|
ประวัติการแก้ไข
2019-03-09 03:26:07
|
 |
 |
 |
 |
| Date :
2019-03-09 03:24:28 |
By :
nattjaima |
View :
864 |
Reply :
1 |
|
 |
 |
 |
 |
|
|
|
|
 |