 |
|
|
 |
 |
|
คำค้น html canvas + javascript graphic library
|
 |
 |
 |
 |
| Date :
2019-05-28 16:16:42 |
By :
Chaidhanan |
|
 |
 |
 |
 |
|
|
 |
 |
|
 |
 |
 |
|
|
 |
 |
|
ตาม
|
 |
 |
 |
 |
| Date :
2019-05-28 22:57:26 |
By :
เอ |
|
 |
 |
 |
 |
|
|
 |
 |
|
 |
 |
 |
|
|
 |
 |
|
Code (PHP)
<script>
function addnum(){
document.all.txtint.value++;
}
function delnum(){
document.all.txtint.value--;
}
</script>
<input name="txtint" type="button" id="txtint1" value="0"/>
<br>
<a href="javascript:void(0);" onclick="addnum()"> ++ </a>
<br>
<a href="javascript:void(0);" onclick="delnum()"> - - </a>
Code (PHP)
<html>
  <head>
    <script type="text/javascript" src="https://www.gstatic.com/charts/loader.js"></script>
    <script type="text/javascript">
      google.charts.load('current', {'packages':['corechart']});
      google.charts.setOnLoadCallback(drawChart);

      function drawChart() {
        var data = google.visualization.arrayToDataTable([
          ['Age', 'Weight'],
          [ 1,      1],
          [ 2,      2],
          [ 3,      3],
          [ 4,      2],
          [ 5,      1],
          [ 6,      0]
        ]);

        var options = {
          title: 'Age vs. Weight comparison',
          hAxis: {title: 'Age', minValue: 0, maxValue: 10},
          vAxis: {title: 'Weight', minValue: -5, maxValue: 5},
          legend: 'none'
        };

        var chart = new google.visualization.ScatterChart(document.getElementById('chart_div'));

        chart.draw(data, options);
      }
    </script>
  </head>
  <body>
    <div id="chart_div" style="width: 900px; height: 500px;"></div>
  </body>
</html>
มีโค้ดบวกเลขกับกราฟ เเบบนี้ใช้ได้ไหมครับ
เเต่ผมจะเอามารวมกันยังไงครับ ให้กดที่บวกเลขเเล้วขึ้นที่กราฟ
|
ประวัติการแก้ไข
2019-05-29 08:42:24
 |
 |
 |
 |
| Date :
2019-05-29 08:42:00 |
By :
1768876979829526 |
|
 |
 |
 |
 |
|
|
 |
 |
|
 |
 |
 |
|
|
 |
 |
|
อันนี้ผมเขียนขึ้นมาเล่น ๆคับ ลองเอาไปรันดู
Code (PHP)
<!DOCTYPE html>
<html lang="en">
  <head>
    <meta charset="utf-8">
    <meta http-equiv="X-UA-Compatible" content="IE=edge">
    <meta name="viewport" content="width=device-width, initial-scale=1">
	<title>ChartJs</title>

  </head>
  <body>
  <div class="chart-container" style="position: relative; height:40vh; width:80vw">
    <canvas id="myChart" ></canvas>
    <form name="frm" method="get" action="<?php echo $_SERVER['SCRIPT_NAME'];?>">
    <input type="text" id="txtint1" value="<?php echo $_GET["txtint"];?>" disabled/>
    <input name="txtint" type="hidden" id="txtint1" value="<?php echo $_GET["txtint"];?>"/>
<br>
<input type="submit" href="javascript:void(0);" onclick="addnum()" value="+1">
<br>
<input type="submit" href="javascript:void(0);" onclick="delnum()" value="-1">
    </form>
  </div>
  <script>
function addnum(){
document.all.txtint.value++;
}
function delnum(){
document.all.txtint.value--;
}
</script>
	<script src="https://cdnjs.cloudflare.com/ajax/libs/Chart.js/2.4.0/Chart.js"></script>
	<script>
        var value1 = document.getElementById("txtint1").value;
		var ctx = document.getElementById("myChart");
		var myChart = new Chart(ctx, {
			type: 'line',
			data: {
                /*ค่าในแนวนอน*/
				labels: ["HTML", "PHP", "JAVA", "Python", "C#", "Dajago"],
				datasets: [{
					label: '# of Votes',
					data: [value1, 19, 3, 5, 2, 3],
					backgroundColor: [
						'rgba(255, 99, 132, 0.2)',
					],
					borderColor: [
						'rgba(255,99,132,1)',
					],
					borderWidth: 1
				}]
			},
			options: {
				scales: {
					yAxes: [{
						ticks: {
							beginAtZero:true
						}
					}]
				}
			}
		});
		</script>
  </body>
</html>
|
ประวัติการแก้ไข
2019-05-30 10:08:46
 |
 |
 |
 |
| Date :
2019-05-30 10:07:04 |
By :
nobetaking |
|
 |
 |
 |
 |
|
|
 |
 |
|
 |
 |
 |
|
|
 |
 |
|
มีใครพอจะมีเเนวทางไหนครับ
|
 |
 |
 |
 |
| Date :
2019-06-01 19:39:21 |
By :
เเ |
|
 |
 |
 |
 |
|
|
 |
 |
|
 |
 |
 |
|
|
 |
 |
|
คำค้น html canvas + javascript graphic library
ลองหาอ่านดูก่อนไหมครับ มันตรง concept ที่ต้องการ
กราฟคือการวาดรูป เมือวาดเป็น ก็จะได้รู้ว่าจะกำหนดมุมองศายังไงต่อไป
ตัวอย่างมันต้องใช้ความรู้เรื่อง การเชียนรูป ไปอ่าน document จากต้นฉบับเลย จะได้รู้เองทำเองได้
|
 |
 |
 |
 |
| Date :
2019-06-01 19:49:33 |
By :
Chaidhanan |
|
 |
 |
 |
 |
|
|
 |
 |
|
 |
 |
 |
|
|
 |
 |
|
ก็สร้างเป็นฐานข้อมูลแล้วดึงออกมาก็ได้ครับ
อันนี้ผมลองทำได้ผลแล้ว
1.สร้างฐานข้อมูล
Code (SQL)
CREATE TABLE `chart` (
  `id` int(11) NOT NULL,
  `title` varchar(255) NOT NULL,
  `score` int(11) NOT NULL
) ENGINE=InnoDB DEFAULT CHARSET=utf8;

INSERT INTO `chart` (`id`, `title`, `score`) VALUES
(1, 'A', 5000),
(2, 'B', 3500),
(3, 'C', 2000),
(4, 'D', 4000);

ALTER TABLE `chart`
  ADD PRIMARY KEY (`id`);
2.สร้างหน้า test.php
Code (PHP)
<?php
$servername = "*****";
$username = "******";
$password = "*****";
$dbname = "******";
	$conn = mysqli_connect($servername, $username, $password, $dbname);

	if (!$conn) {
		die("Connection failed: " . mysqli_connect_error());
	}

	$sql = "SELECT * FROM chart";
	$result = mysqli_query($conn, $sql);

	if (mysqli_num_rows($result) > 0) {

		while($row = mysqli_fetch_assoc($result)) {

			$labels[] = $row['title'];

			$data[] = $row['score'];
		}
	}

?>

<!DOCTYPE html>
<html lang="en">
  <head>
    <meta charset="utf-8">
    <meta http-equiv="X-UA-Compatible" content="IE=edge">
    <meta name="viewport" content="width=device-width, initial-scale=1">
	<title>ChartJs</title>

  </head>

  <body>

  <div class="chart-container" style="position: relative; height:40vh; width:80vw">
	<canvas id="myChart"></canvas>
  <table width="100" border="1">
  <tr>
    <td>
  <form action="../test/test2.php" method="POST">
   <input type="hidden" name="add" value="1">
   <button type="submit">+1</button>
  </form>
    </td>
    <td>
    <form action="../test/test2.php" method="POST">
   <input type="hidden" name="add" value="2">
   <button type="submit">-1</button>
  </form>
    </td>
  </tr>
  </table>
  </div>

	<script src="https://cdnjs.cloudflare.com/ajax/libs/Chart.js/2.4.0/Chart.js"></script>
	<script>
	var ctx = document.getElementById("myChart");
	var myChart = new Chart(ctx, {
		//type: 'bar',
		//type: 'line',
		type: 'line',
		data: {
			labels: <?=json_encode($labels)?>,
			datasets: [{
				label: 'Report',
				data: <?=json_encode($data, JSON_NUMERIC_CHECK);?>,
				backgroundColor: [
					'rgba(255, 99, 132, 0.2)',
				],
				borderColor: [
					'rgba(255,99,132,1)',
				],
				borderWidth: 0
			}]
		},
		options: {
			scales: {
				yAxes: [{
					ticks: {
						beginAtZero:true
					}
				}]
			},
			 responsive: true,
			 title: {
				display: true,
				text: 'ตัวอย่างการใช้งาน Chart Js'
			}
		}
	});
	</script>

  </body>
</html>
3.สร้างหน้า test2.php
Code (PHP)
<?php
  $servername = "*******";
  $username = "*************";
  $password = "**********";
  $dbname = "**********";
      $conn = mysqli_connect($servername, $username, $password, $dbname);

      if (!$conn) {
          die("Connection failed: " . mysqli_connect_error());
      }

  if($_POST['add']=='1'){
    $sql_new = "SELECT * FROM chart ORDER BY id DESC LIMIT 0,1";
    $query_new = mysqli_query($conn,$sql_new)or die ($sql_new);
    $result_new = mysqli_fetch_array($query_new);
    $score = $result_new['score']+1;
    $title = $result_new['title']+1;
    if($query_new==TRUE){
      $sql_add = "INSERT INTO chart (title,score)VALUES('$title','$score')";
      $objQuery = mysqli_query($conn,$sql_add) or die ($sql_add);
      header("Location: ../test/test.php");
    }

  }else if($_POST['add']=='2'){
    $sql_new = "SELECT * FROM chart ORDER BY id DESC LIMIT 0,1";
    $query_new = mysqli_query($conn,$sql_new)or die ($sql_new);
    $result_new = mysqli_fetch_array($query_new);
    $score = $result_new['score']-1;
    $title = $result_new['title']+1;
    if($query_new==TRUE){
      $sql_add = "INSERT INTO chart(title,score)VALUES('$title','$score')";
      $objQuery = mysqli_query($conn,$sql_add) or die ($sql_add);
      header("Location: ../test/test.php");
    }
  }

  ?>
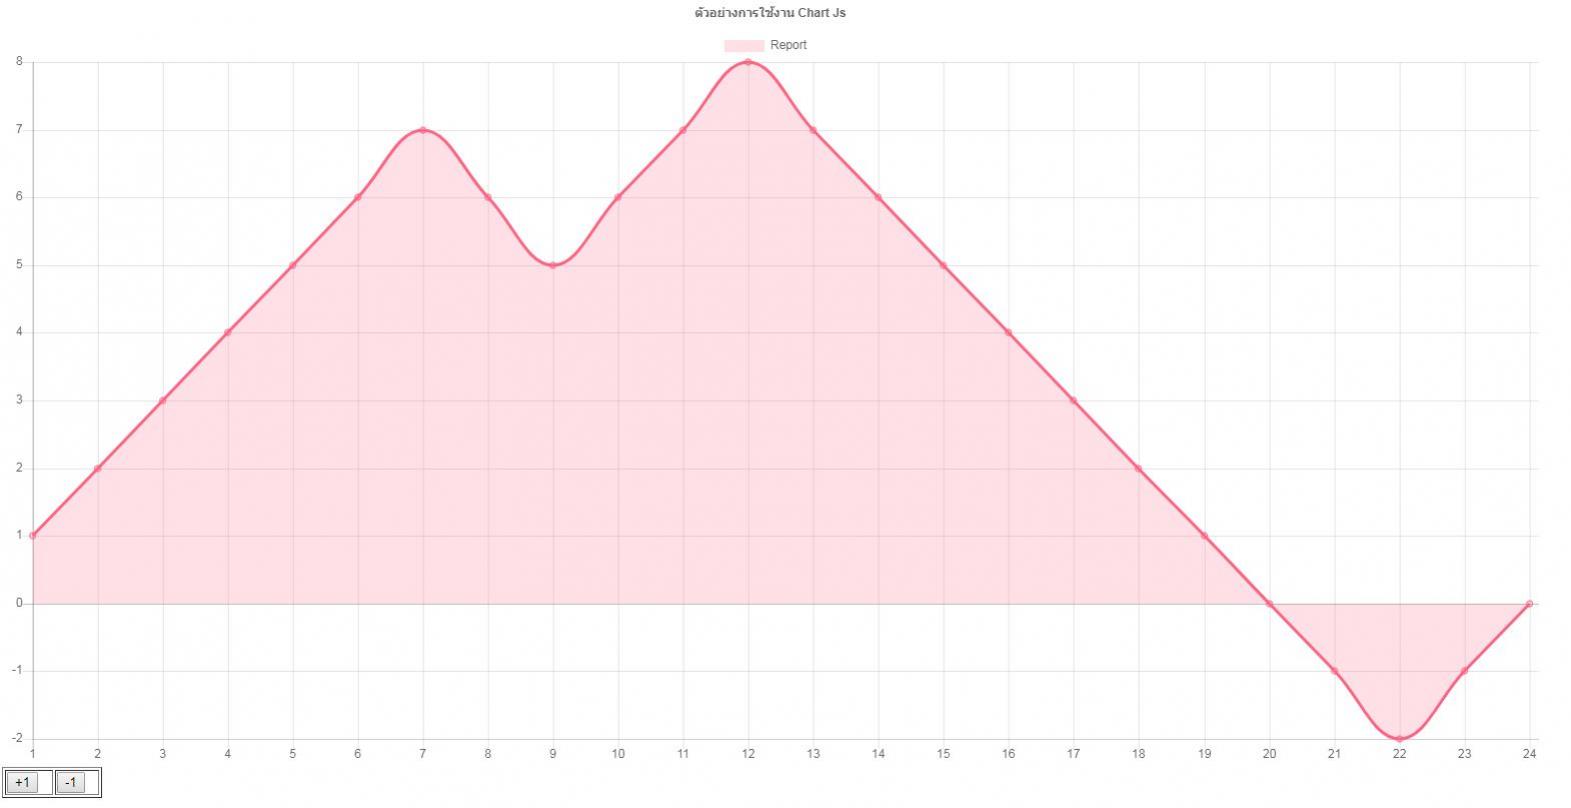
ผลลัพธ์

ลองนำไปปรับดูครับ พอเป็นแนวทาง
|
 |
 |
 |
 |
| Date :
2019-06-06 15:51:22 |
By :
nobetaking |
|
 |
 |
 |
 |
|
|
 |
 |
|
 |
 |
|