 |
ช่วยหน่อยครับ เรื่องถ้าเราต้องการแก้ไขกราฟจากฐานข้อมูล |
| |
 |
|
|
 |
 |
|
จากโค้ดด้านล่าง หากเราต้องการให้ดึงข้อมูลคะแนนจากคอลัมน์ total1 และคอลัมน์ total2 ของนักเรียนแต่ละคนมาเปรียบเทียบกัน ต้องแก้ไขโค้ดตรงไหนบ้างครับ (โค้ดด้านล่างจะแสดงเพียง total1) ขอบคุณครับ
Code (PHP)
<? session_start();?>
<html>
<head>
    <meta charset="utf-8">
    <title>รายงานผลคะแนนรวม</title>
</head>
<?php
$con= mysqli_connect("localhost","xxxxxx","yyyyyy","zzzzzz") or die("Error: " . mysqli_error($con));

mysqli_query($con, "SET NAMES 'utf8' ");

$query = "SELECT total1 AS total1, total2 AS total2 FROM aaaaaaaa WHERE UserID = '".$_SESSION['UserID']."' ";

$result = mysqli_query($con, $query);
$resultchart = mysqli_query($con, $query);


//for chart
$total2 = array();
$total1 = array();

while($rs = mysqli_fetch_array($resultchart)){
  $total1[] = "\"".$rs['total1']."\"";
  $total2[] = "\"".$rs['total2']."\"";
}
$total1 = implode(",", $total1);
$total2 = implode(",", $total2);
?>

<h3 align="center">รายงานผลคะแนนรวม</h3>

<?php mysqli_close($con);?>

<script type="text/javascript" src="https://cdnjs.cloudflare.com/ajax/libs/Chart.js/2.6.0/Chart.bundle.js"></script>
<hr>
<p align="center">

<canvas id="myChart" width="800px" height="300px"></canvas>
<script>
var ctx = document.getElementById("myChart").getContext('2d');
var myChart = new Chart(ctx, {
    type: 'bar',
    data: {
        labels: [<?php echo $total1;?>

        ],
        datasets: [{
            label: 'รายงานผลคะแนนรวม 4 วิชา 200 คะแนน',
            data: [<?php echo $total1;?>
            ],

            backgroundColor: [
                'rgba(255, 99, 132, 0.2)',
                'rgba(54, 162, 235, 0.2)',
                'rgba(255, 206, 86, 0.2)',
                'rgba(75, 192, 192, 0.2)',
                'rgba(153, 102, 255, 0.2)',
                'rgba(255, 159, 64, 0.2)'
            ],
            borderColor: [
                'rgba(255,99,132,1)',
                'rgba(54, 162, 235, 1)',
                'rgba(255, 206, 86, 1)',
                'rgba(75, 192, 192, 1)',
                'rgba(153, 102, 255, 1)',
                'rgba(255, 159, 64, 1)'
            ],
            borderWidth: 1

        }]


    },
    options: {
        scales: {
            yAxes: [{
                ticks: {
                    beginAtZero:true
                }
            }]
        }
    }
});
</script>


</p>
  <!--devbanban.com-->
</html>
Tag : PHP, MySQL
|
|
|
 |
 |
 |
 |
| Date :
2019-08-05 12:40:50 |
By :
mrtee741 |
View :
799 |
Reply :
1 |
|
 |
 |
 |
 |
|
|
|
|
 |
 |
|
 |
 |
 |
|
|
 |
 |
|
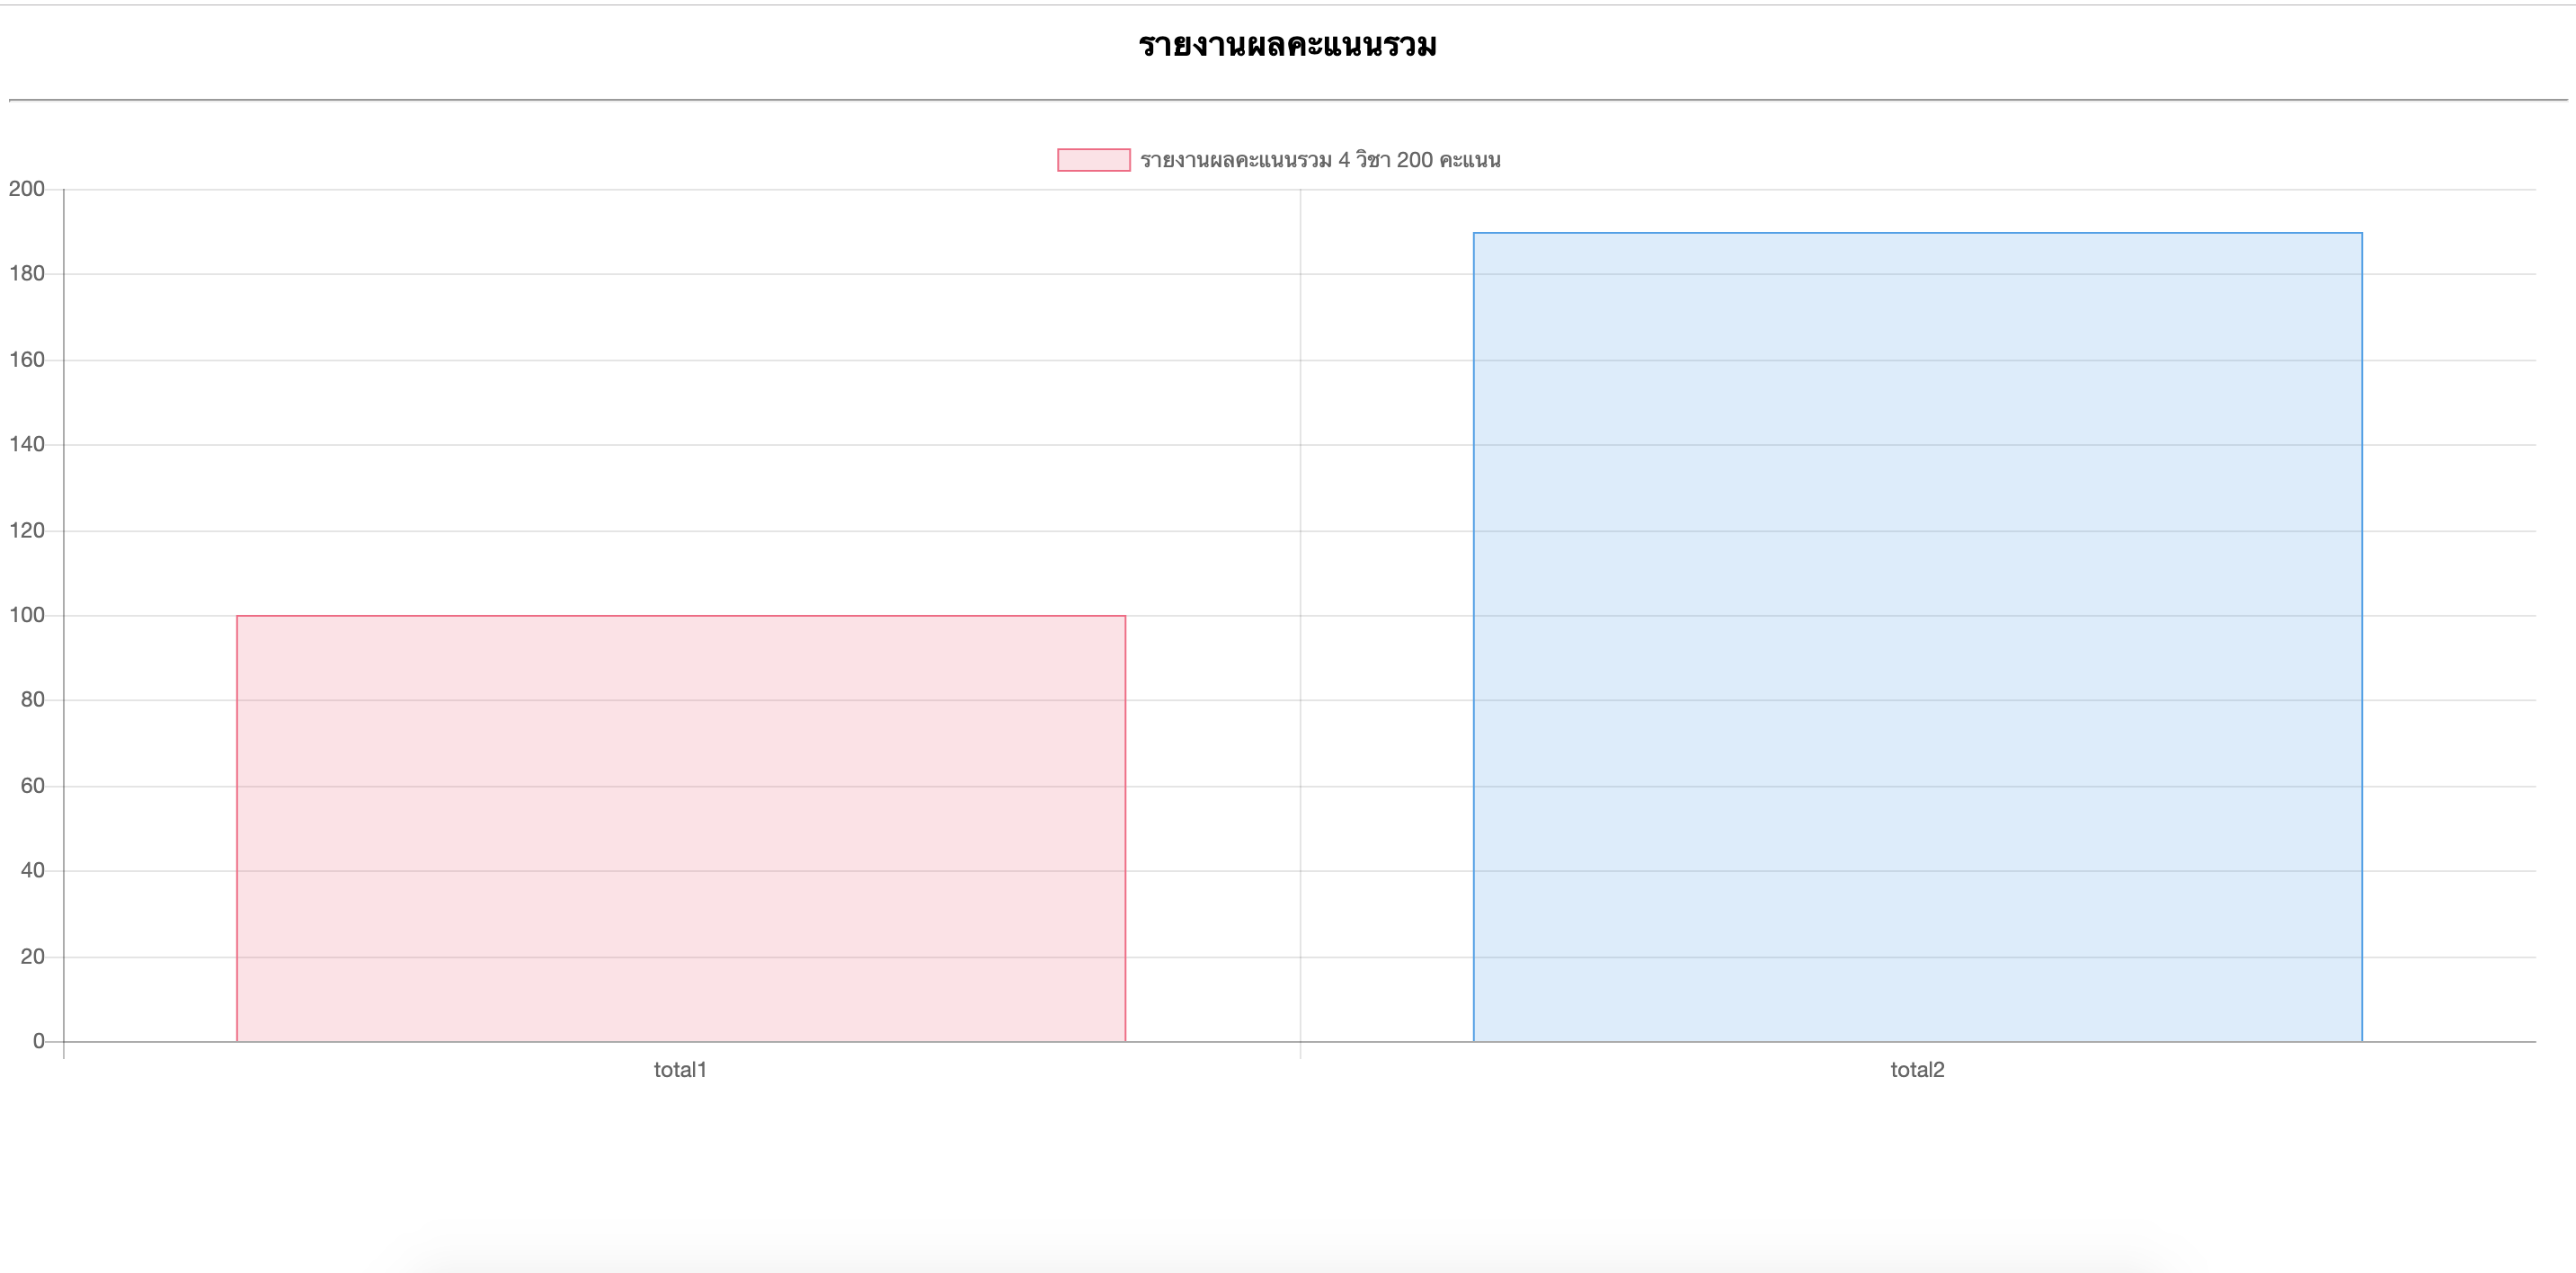
Code (PHP)
<html>
<head>
    <meta charset="utf-8">
    <title>รายงานผลคะแนนรวม</title>
</head>
<h3 align="center">รายงานผลคะแนนรวม</h3>
<script type="text/javascript" src="https://cdnjs.cloudflare.com/ajax/libs/Chart.js/2.6.0/Chart.bundle.js"></script>
<hr>
<p align="center">

<canvas id="myChart" width="800px" height="300px"></canvas>
<script>
var ctx = document.getElementById("myChart").getContext('2d');
var myChart = new Chart(ctx, {
    type: 'bar',
    data: {
        labels: ["total1",'total2'],
        datasets: [{
            label: 'รายงานผลคะแนนรวม 4 วิชา 200 คะแนน',
            data: [100,190],

            backgroundColor: [
                'rgba(255, 99, 132, 0.2)',
                'rgba(54, 162, 235, 0.2)',
                'rgba(255, 206, 86, 0.2)',
                'rgba(75, 192, 192, 0.2)',
                'rgba(153, 102, 255, 0.2)',
                'rgba(255, 159, 64, 0.2)'
            ],
            borderColor: [
                'rgba(255,99,132,1)',
                'rgba(54, 162, 235, 1)',
                'rgba(255, 206, 86, 1)',
                'rgba(75, 192, 192, 1)',
                'rgba(153, 102, 255, 1)',
                'rgba(255, 159, 64, 1)'
            ],
            borderWidth: 1

        }]


    },
    options: {
        scales: {
            yAxes: [{
                ticks: {
                    beginAtZero:true
                }
            }]
        }
    }
});
</script>


</p>
  <!--devbanban.com-->
</html>

|
 |
 |
 |
 |
| Date :
2019-08-08 11:47:18 |
By :
mongkon.k |
|
 |
 |
 |
 |
|
|
 |
 |
|
 |
 |
|
|