 |
ืืืืืต้องการทำ linear regression กับเว็บ จากค่าที่รับจากผู้ใช้ และนำ timestamp หรือวันเดือนปีที่ผู้ใช้ส่งค่ามาใช้ด้วยครับ |
| |
 |
|
|
 |
 |
|
เก็บข้อมูลลูกค้า และข้อมูลรายละเอียดรถก่อน จากนั้น ค่อยมาจัดเก็บข้อมูลการเข้ารับบริการ ในแต่ละครั้งก็จัดเก็บเลขไมล์ และวันที่เขารับบริการ
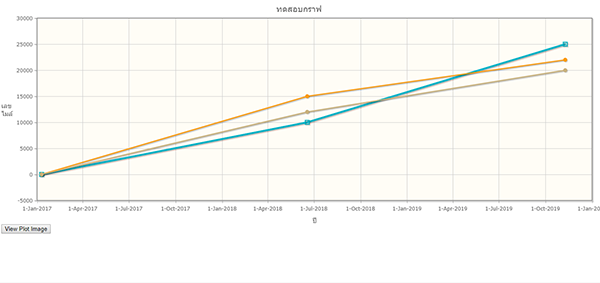
การแสดงผลเป็นกราฟ ก็เอาข้อมูลปี และเลขไมล์ มา plot และยังคำนวณอื่นๆ ได้อีกครับ ตอนนี้ติดปัญหาอะไรครับ
|
 |
 |
 |
 |
| Date :
2019-11-08 13:56:56 |
By :
Manussawin |
|
 |
 |
 |
 |
|
|
 |
 |
|
 |
 |
 |
|
|
 |
 |
|
ต้องเก็บลงฐานข้อมูลครับ ส่วนเรื่องกราฟ มี plugin ให้ใช้ เยอะแยะมากครับ หากว่าเพิ่งเริ่มต้นเขียนโปรแกรม แนะนำให้ลองอ่านบทเรียน และทำ workshop ดูก่อนครับ
https://www.thaicreate.com/php.html
|
 |
 |
 |
 |
| Date :
2019-11-08 14:46:20 |
By :
Manussawin |
|
 |
 |
 |
 |
|
|
 |
 |
|
 |
 |
 |
|
|
 |
 |
|
สามารถใช้ function ของแต่ละชนิดฐานข้อมูลที่ใช้ เช่น now() ของ mysql หรือ getdate() ของ mssql และยังสามารถใช้ function date() ของ php ก็ได้ครับ อยู่ที่ว่าต้องการทำแบบไหน ตามความเหมาะสมของระบบ
|
 |
 |
 |
 |
| Date :
2019-11-08 15:49:43 |
By :
Manussawin |
|
 |
 |
 |
 |
|
|
 |
 |
|
 |
 |
 |
|
|
 |
 |
|
ต้องเข้าใจเรื่องชนิดข้อมูลด้วยนะครับ และการเรียกใช้ function เราจะไม่ใช้ 'now()' แบบนี้ การใช้ function จะต้องเรียกใช้ now() แบบนี้ครับ
Code (PHP)
<?php
require 'Connect.php';

$query = "INSERT INTO nummiles (NumMiles,DateAccept) VALUES ('$_POST[NumMile]',now())";

$result = mysqli_query($dbcon, $query);

if ($result) {
echo "เพิ่มข้อมูลเรียบร้อย";
echo "<br>";echo "<br>";echo "<br>";
} else{
echo "เกิดข้อผิดพลาด".mysqli_error($dbcon);
}
?>
|
 |
 |
 |
 |
| Date :
2019-11-08 16:09:04 |
By :
Manussawin |
|
 |
 |
 |
 |
|
|
 |
 |
|
 |
 |
 |
|
|
 |
 |
|
เรื่องกราฟลองศึกษาดูครับ ตัวนี้เป็น jQuery Plugin มี Demo และ Document ให้เลือกใช้รูปแบบกราฟ ตามความเหมาะสมนะครับ
jqplot
|
 |
 |
 |
 |
| Date :
2019-11-08 16:14:26 |
By :
Manussawin |
|
 |
 |
 |
 |
|
|
 |
 |
|
 |
 |
 |
|
|
 |
 |
|
เก็บข้อมูลลูกค้าเพิ่มเข้าไปด้วยครับ จะได้เอาไว้แยกว่าเป็นของใคร
|
 |
 |
 |
 |
| Date :
2019-11-08 16:45:39 |
By :
Manussawin |
|
 |
 |
 |
 |
|
|
 |
 |
|
 |
 |
 |
|
|
 |
 |
|
ตัวอย่างจากเว็บที่ผมให้ไป ลองศึกษาดูครับ Document ก็มีให้ ตัวอย่างก็มีให้ครับ ผมลองทำเล่นๆ ก็ลองศึกษาดูครับ
Code (PHP)
<!doctype html>
<html lang="en">
 <head>
	<meta charset="UTF-8">
	<title>Document</title>
	<link rel="stylesheet" type="text/css" href="http://www.jqplot.com/src/jquery.jqplot.css" />
	<link type="text/css" rel="stylesheet" href="http://www.jqplot.com/examples/syntaxhighlighter/styles/shThemejqPlot.min.css" />

	<!--[if lt IE 9]><script language="javascript" type="text/javascript" src="../src/excanvas.js"></script><![endif]-->
	<script type="text/javascript" src="http://ajax.googleapis.com/ajax/libs/jquery/1.9.1/jquery.min.js"></script>
	<script type="text/javascript" src="http://www.jqplot.com/src/jquery.jqplot.js"></script>
<!-- End Don't touch this! -->

<!-- Additional plugins go here -->

  <script type="text/javascript" src="http://www.jqplot.com/src/plugins/jqplot.canvasTextRenderer.js"></script>
  <script type="text/javascript" src="http://www.jqplot.com/src/plugins/jqplot.canvasAxisLabelRenderer.js"></script>
  <script type="text/javascript" src="http://www.jqplot.com/src/plugins/jqplot.dateAxisRenderer.js"></script>
  <script language="javascript" type="text/javascript" src="http://www.jqplot.com/src/plugins/jqplot.cursor.js"></script>
 </head>
 <body>
  <div id="chart2" style="height:500px; width:100%;"></div>

  <script type="text/javascript">
$(document).ready(function(){
    // Enable plugins like highlighter and cursor by default.
    // Otherwise, must specify show: true option for those plugins.
    $.jqplot.config.enablePlugins = true;

    var line1=[['2017-01-10', 0], ['2018-06-18', 10000], ['2019-11-09', 25000]];
	var line2=[['2017-01-10', 0], ['2018-06-18', 15000], ['2019-11-09', 22000]];
	var line3=[['2017-01-10', 0], ['2018-06-18', 12000], ['2019-11-09', 20000]];

    var plot1 = $.jqplot('chart2', [line1,line2,line3], {
        title:'ทดสอบกราฟ',
        axes:{
            xaxis:{
				label: "ปี",
                renderer:$.jqplot.DateAxisRenderer,
                rendererOptions:{
                    tickRenderer:$.jqplot.CanvasAxisTickRenderer
                },
                tickOptions:{
                    fontSize:'10pt',
                    fontFamily:'Tahoma',
                    angle:-40
                }
            },
            yaxis:{
				label: "เลขไมล์",
                rendererOptions:{
                    tickRenderer:$.jqplot.CanvasAxisTickRenderer},
                    tickOptions:{
                        fontSize:'10pt',
                        fontFamily:'Tahoma',
                        angle:30
                    }
            }
        },
        series:[{ lineWidth:4, markerOptions:{ style:'square' } }],
        cursor:{
            zoom:true,
            looseZoom: true
        }
    });

});
</script>
<script type="text/javascript" src="http://www.jqplot.com/examples/example.js"></script>
 </body>
</html>

|
ประวัติการแก้ไข
2019-11-09 12:00:02
2019-11-09 12:00:28
2019-11-09 13:20:10
 |
 |
 |
 |
| Date :
2019-11-09 11:58:39 |
By :
Manussawin |
|
 |
 |
 |
 |
|
|
 |
 |
|
 |
 |
 |
|
|
 |
 |
|
ดึงข้อมูล แล้ว loop เอาค่าไปใส่เลยครับ
|
 |
 |
 |
 |
| Date :
2019-11-11 13:51:23 |
By :
Manussawin |
|
 |
 |
 |
 |
|
|
 |
 |
|
 |
 |
 |
|
|
 |
 |
|
อยู่ที่เราจะเลือกใช้ครับ จะรวมกราฟเดียวกัน เพิ่ม label แยกเป็นชื่อลูกค้า หรือจะแยก เป็น กราฟของแต่ละคนก็ทำได้ครับ
|
 |
 |
 |
 |
| Date :
2019-11-18 09:06:57 |
By :
Manussawin |
|
 |
 |
 |
 |
|
|
 |
 |
|
 |
 |
 |
|
|
 |
 |
|
 ตอบความคิดเห็นที่ : 27 เขียนโดย : Manussawin เมื่อวันที่ 2019-11-18 09:06:57 ตอบความคิดเห็นที่ : 27 เขียนโดย : Manussawin เมื่อวันที่ 2019-11-18 09:06:57
รายละเอียดของการตอบ ::
ผมได้ลองๆประยุกต์กับ code ทำกราฟปกติดูครับ ไม่ค่อยเข้าใจว่าต้องเขียนแบบไหนครับ แบบไม่ต้องมานั่ง WHERE ชื่อ = ได้มั้ยครับ เพราะข้อมูลบางทีก็มีคนกรอกเข้ามาหลายคน หลายชื่อ ต้องการจะพลอตแยกคน แยกกราฟไปเลยครับ
Code (PHP)
<br><br><a href="index.php"><input name="btnSubmit" type="submit" value=" <<< กลับหน้าแรก "></a><br>

<?php

    require 'Connect.php';

		$NumMiles = $_POST['NumMiles'];
		$DateAccept = $_POST['DateAccept'];
    $graph = "SELECT * FROM nummilesinfor WHERE FirstName = 'สิรวิชญ์' ";

    $result = mysqli_query($dbcon, $graph);

    if ($result) {
      echo "เพิ่มข้อมูลเรียบร้อย";
      echo "<br>";echo "<br>";echo "<br>";
    } else{
      echo "เกิดข้อผิดพลาด".mysqli_error($dbcon);
    }
?>
<!DOCTYPE html>
<html>
<head>
<meta charset="utf-8">
	<title>easy chart</title>

<script src="https://ajax.googleapis.com/ajax/libs/jquery/1.11.3/jquery.min.js"></script>
<script src="https://code.highcharts.com/highcharts.js"></script>
<script src="https://code.highcharts.com/modules/exporting.js"></script>

<!-- ตั้งค่า -->
<script type="text/javascript">
$(function () {
    $('#container').highcharts({
        //ชื่อกราฟ
        title: {
            text: 'กราฟกำหนดระยะเวลาการสลับยางของลูกค้า ',
            x: -20 //center
        },
        subtitle: {
            text: 'http://www.highcharts.com/',
            x: -20
        },
        //แนวนอน
        xAxis:   title: {
							text: 'วันที่ ลูกค้ากรอกเลขไมล์เข้ามา'
					},
					plotLines: [{
							value: 0,
							width: 1,
							color: '#808080'
					}]
				{
            data: [
							<?php
							echo $DateAccept
						  ?>
        },
        //ชื่อข้อมูลแนวตั้ง
        yAxis: {
            title: {
                text: 'เลขไมล์ของรถยนต์ลูกค้า(กิโลเมตร)'
            },
            plotLines: [{
                value: 0,
                width: 1,
                color: '#808080'
            }]
        },
        tooltip: {
            valueSuffix: 'กิโลเมตร'
        },
        legend: {
            layout: 'vertical',
            align: 'right',
            verticalAlign: 'middle',
            borderWidth: 0
        },
        series: [{
        //     name: 'Tokyo',
        //     data: [7.0, 6.9, 9.5, 14.5, 18.2, 21.5, 25.2, 26.5, 23.3, 18.3, 13.9, 9.6]
        // }, {
            name: 'ข้อมูลของลูกค้า',
            data: [
            <?php  //วนซ้ำข้อมูล 1-12
                for ($i = 0; $i < 12; $i++) {
                    if($i>0){
                        echo ',';
                    }
                    echo $NumMiles; //ข้อมูลตัวเลข
                }
            ?>

            ]
        },
            ?>]
        }]
    });
});
</script>

</head>
<body>

<div id="container" style="min-width: 310px; height: 400px; margin: 0 auto"></div>


</body>
</html>
|
ประวัติการแก้ไข
2019-11-18 16:07:12
 |
 |
 |
 |
| Date :
2019-11-18 16:05:23 |
By :
SmartMRT |
|
 |
 |
 |
 |
|
|
 |
 |
|
 |
 |
 |
|
|
 |
 |
|
รบกวนขอความช่วยเหลือหน่อยครับผม T T
ติดต่อทางเมลได้ครับ [email protected] หรือ
Facebook : Mart Sirawit
Line : smartheartfood
|
 |
 |
 |
 |
| Date :
2019-11-21 11:43:15 |
By :
SmartMRT |
|
 |
 |
 |
 |
|
|
 |
 |
|
 |
 |
|
|